To use PostgreSQL replication it is necessary to change the wal_level from “minimal” to “hot_standby”. But, which impact does this change have on the amount of WAL actually written to disk? And which impacts does it have in performance? Many people have been asking this question in the past, so I thought I'd give it a try and do a small benchmark.
The test setup
The test is pretty simple: I have used PostgreSQL 9.3.3. In each case I used a freshly created test instance ...
|
1 2 3 |
initdb -D $PGDATA createdb $DB pgbench -F 70 -s 100 -i $DB |
We are performing this test with a FILLFACTOR of 70% to make sure that we are as realistic as possible. A scale factor of 100 will provide us with 10 mio rows of test data, which is also a reasonable amount of data to test with.
Importing data
After running initdb and pgbench we do our first check to see, how much xlog we have written:
|
1 2 3 4 5 |
wal_level: xlog position: xlog in bytes: minimal: 0/2440820 38012960 archive: 0/50118B68 1343327080 hot_standby: 0/5011A5D8 1343333848 |
Many may ask why there is a 35 fold increase in the amount of xlog here?
The reason is actually very simple and can be found deep inside the code of pgbench itself:
|
1 2 3 4 5 6 7 8 9 |
fprintf(stderr, "creating tables...n"); executeStatement(con, "begin"); executeStatement(con, "truncate pgbench_accounts"); res = PQexec(con, "copy pgbench_accounts from stdin"); if (PQresultStatus(res) != PGRES_COPY_IN) { ... |
To import things faster pgbench truncates the underlying tables before inserting data. In case of wal_level = minimal this will make sure that PostgreSQL does not have to write xlog for a table at all (transaction log bypass). Using truncate is a neat trick to speed up imports in general.
In addition to a sharp increase in xlog creation from “minimal” --> “archive” we see that the amount of xlog created by “archive” and “hot_standby” are virtually the same. This is pretty much expected. All “hot_standby” does on top of “archive” is to store some information about running transactions - during an import this is really not a big deal.
Running OLTP
In the next step we run a little test to see which differences there are for a typical OLTP workload.
Our test is pretty simple:
|
1 |
pgbench -j 32 -M prepared -t 5000 $DB -c 32 |
This leaves us with a total of 160.000 transactions.
|
1 2 3 4 5 |
wal_level xlog_position: xlog used in test: minimal 0/3DC80778 998506328 archive 0/8B991280 998737688 hot_standby 0/8B96F8F8 998593312 |
In a normal OLTP test there is basically no difference. I assume that the slightly smaller numbers for hot_standby are related to timing issues during checkpoints towards the end of the test. A normal OLTP test writes pretty straight forward logs so there is no real difference. There are no magic things such as xlog bypasses and so on.
The conclusion here is that the WAL level really only makes a difference when you are about to benefit from the WAL bypassing codes.
Find out more crucial PostgreSQL logging tips and tricks in our special blog section all about WAL.
When it comes to performance, people tend to forget some basic topics entirely. One of those topics is the impact of writing log files. No, in a typical OLTP workload the creation of log files is definitely not free (in terms of performance). Quite the opposite - having to write millions of lines into a logfile is horribly expensive and can have serious impacts on performance.
For this test we have used our standard box to do benchmarks again: 8 x 4 GHz AMD, 16 GB RAM, Samsung 840 SSD, pgbench with scale factor 100 = 10 mio rows).
Test scenario 1:
The first test scenario is a fairly straight forward one: We only want to log errors (log_statement = none). This translates to no logging, given the fact that pgbench won't produce errors.
The remaining postgresql.conf settings are as follows:
|
1 2 3 4 5 6 7 |
max_connections = 100 shared_buffers = '2 GB' logging_collector = on log_line_prefix = '[%t / %d / %u] - ' |
Running the test works like this:
|
1 |
pgbench -S -j $CONNS -M prepared -T $T $DB -c $CONNS |
We are using 32 concurrent clients and run the test for 20 minutes. The results are the same as the ones we have already observed in previous tests. We get an average of 154.407 transactions per second (reads).
Test scenario 2: Full logging
Let us do a small change now and change log_statement from “none” to “all”.
The drop in performance is highly significant. The transaction count drops to 113.000 per second. This is a highly significant drop. Actually the drop is a little less than I expected but it is still significant.
Test scenario 3: syslog
Finally we wanted to see how syslog behaves. The first thing we noticed was that during the first test run the entire server rebooted after around 30 seconds. The same happened on the second test run. Again, we died after around 30 seconds.
Logically I wanted to see what causes the failure. I started top and ran the test again. This time the benchmark executed nicely. Syslog ate up 85% of one CPU core and memory consumption was pretty stable at around 243 MB. The transaction count showed 91.325 transactions per second.
Interesting: With “top” active, the server survived all tests. It seems top contributes significantly to stability 😉
Seriously: We got to inspect what made syslog fail.
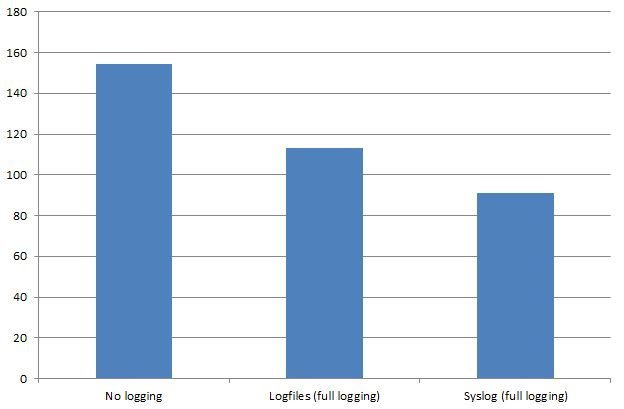
No logging: 154.407
Logfiles (full logging): 113.000
Syslog (full logging): 91.325
It's commonly known that setting max_connections to an insanely high value is not too good for performance. Generations of system administrators have followed this rule. Just out of curiosity I thought I'd give it a try to see which impact setting max_connections in PostgreSQL really has.
UPDATE 2023: See also this more recent blog post by Laurenz Albe: max_connections tuning in PostgreSQL
Again we have used the same hardware to test: 8 AMD cores running at 4 Ghz, 16 GB of RAM, Ubuntu 12.04 as well as a Samsung 840 SSD. Benchmark was running on the box.
To prepare for the test we have created a simple test set using pgbench. The scale factor was set to 100, so that we are running the test using 10 mio rows. Shared buffers are set to 2 GB.
Test 1: Working connections
In a first test we used various settings for max_connections - but, we kept the number of actually open database connections constant. In our case we used CONNS=8 and let the read only benchmark run for 20 min:
|
1 |
pgbench -S -j $CONNS -M prepared -T $T $DB -c $CONNS |
The results are pretty constant. Even if max_connections is massively increased in postgresql.conf, the performance curve of PostgreSQL is totally flat. This is somewhat expected.
The number of transactions per second stays constant at 150.000 / second (reads). So, what is the point of setting max_connections to a low value then?
Test 2: Idle connections
In the next test we want to modify the test setup a little. Again we used 8 working connections running pgbench just like before. But, to make things worse for PostgreSQL we filled up the remaining connections with idle connections. To do so we created database connections running pg_sleep() in background. In short: In case of the 1024 connection test, we had 8 working and 1016 SELECTs running a sleep (= active but idle).
In this case the results start to be interesting. The more connections we got, the lower our TPS count will be. Although the decrease is by no means large, it is still stable and can be observed clearly in the results:
with idle conns (8 workers)
|
1 2 3 4 5 6 7 |
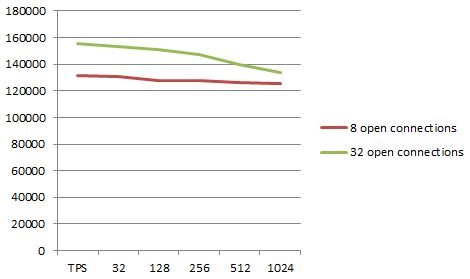
hs@chantal:~/benchmark$ ./run.sh 2> /dev/null 32: tps = 131706.112 128: tps = 130875.520 256: tps = 127894.491 512: tps = 127413.512 1024: tps = 126034.739 2048: tps = 125077.974 |
Test 3: More load ...
Let us repeat the very same test with 32 open connections now and see if the change in throughput given more connections is constant or not.
Here are the results:
|
1 2 3 4 5 6 |
32: tps = 155681.582 128: tps = 153041.9681 256: tps = 151295.710 512: tps = 147398.063 1024: tps = 139920.943 2048: tps = 133637.017 |
What we see here is a substantially higher decline (percentage wise). This is somewhat important because the more loaded the system is, the higher the impact is going to be in this case.
To sum up things we got to point out that max_connections alone is not what causes issues. It is more the combination of many idle connections along with many active ones.
+43 (0) 2622 93022-0
office@cybertec.at