CYBERTEC Logo

PGWatch - PostgreSQL Monitoring Tool

PGWatch is a metrics collector and visualization solution for PostgreSQL databases. It was developed by CYBERTEC. This flexible, self-contained PostgreSQL monitoring tool brings your database monitoring to the next level.

Although there are many PostgreSQL monitoring solutions, most of them are too complex to set up, and too inflexible – they do not allow you to extend their functionality on your own. PGWatch changes all that by providing high flexibility, and by focusing solely on metrics gathering.  The presentation side is left to the best dashboarding tool available.

How PGWatch works

PGWatch works as a remote metrics-gathering daemon, periodically connecting to the database as a normal user would, and reading out metrics provided by the Postgres statistics subsystem. This has the advantage that you don’t need any special user rights and you don’t have to install any extensions on the database server itself, making use in restricted environments (e.g. AWS RDS) possible.

Main features

  • 1-minute installation with Docker (custom installations still possible)
  • Superb overview of all database activities on a single page
  • Easy extensibility by defining metrics in pure SQL
  • Intuitive metrics presentation using the Grafana dashboarding engine. Users can create their own graphs (in addition to predefined ones) with just a couple of clicks
  • server log error monitoring (when installed on DB server)
  • Optional alerting (Mail, Slack, PagerDuty) provided by Grafana
  • Open Source software – free to extend
  • PostgreSQL versions 9.0+ supported

More details

  • Built in web-based management interface for managing monitored databases and metrics
  • Many options for metrics storage – InfluxDB, PostgreSQL, Prometheus, Graphite
  • Optional basic security by user authentication
  • Provides Optional “metrics fetching helper” stored procedures for reading out CPU load and pg_stat_statement info
  • Exposes logs for individual components over the web-based UI for easier troubleshooting

Visit our official website pgwatch.com for further information and instant downloading:

Or read below for more details about pgwatch for enterprise-grade solutions

pgwatch: PostgreSQL Monitoring Tool at Scale

We’ve built pgwatch with scale-up in mind – it’s perfect for monitoring large infrastructures. If you represent a large-scale enterprise, pgwatch is the right monitoring solution for you.

pgwatch can be run for thousands of systems

We have tested pgwatch on large-scale systems and have gathered a large amount of field experience with it. If you want to monitor thousands of systems, pgwatch is certainly the tool you should use.  If you want to use pgwatch for your setup, get in touch with us to find out more.

Screenshots of CYBERTEC’s PGWatch Monitoring Tool

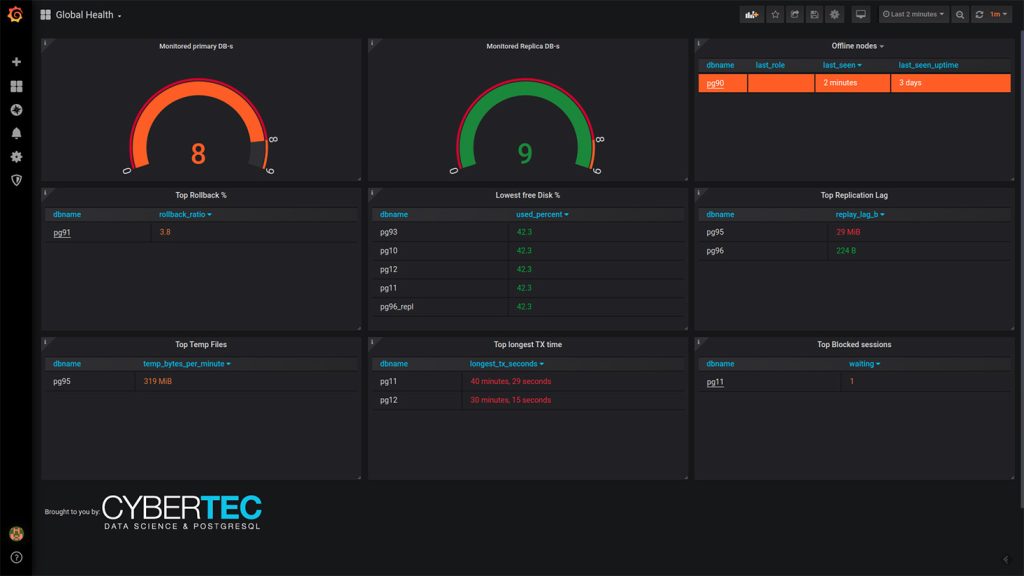
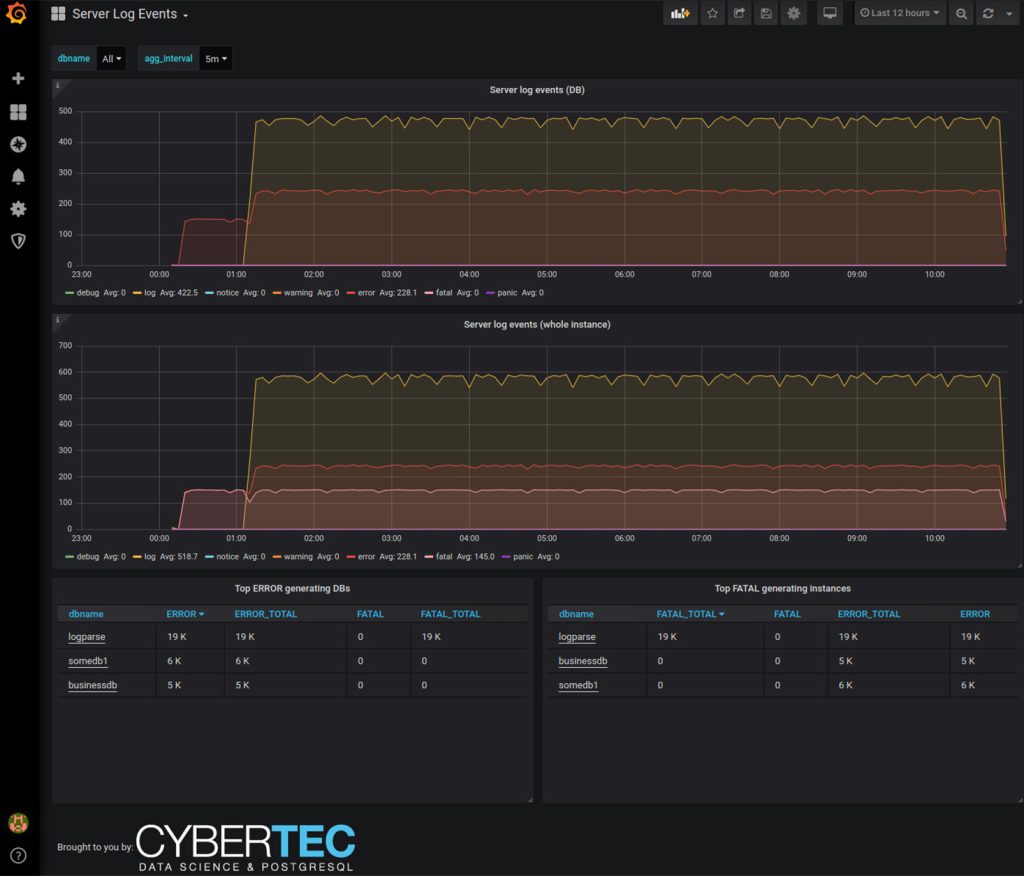
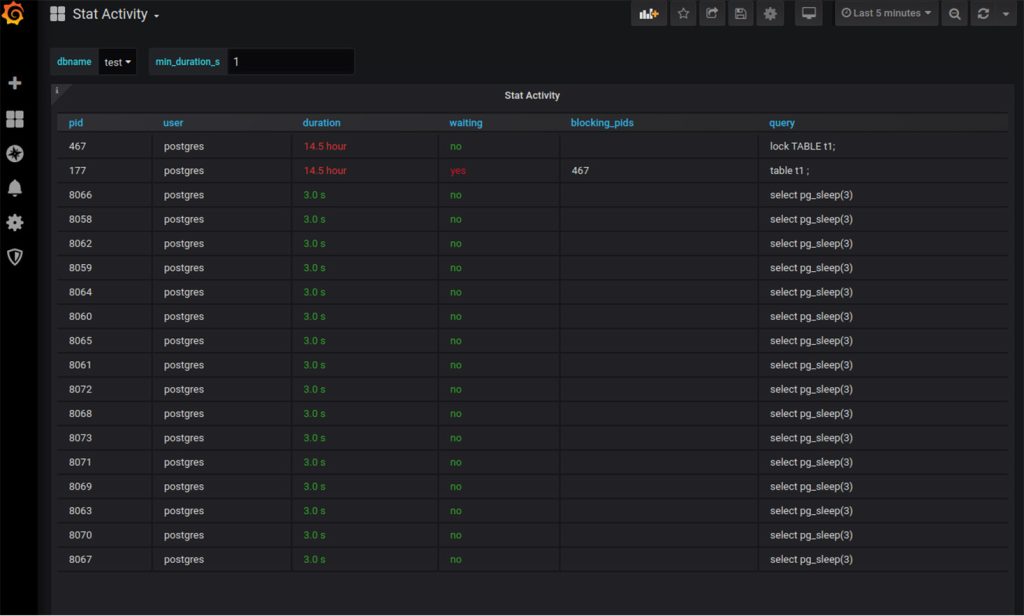
Logically arranged dashboards, i.e. for Global Health, Server Log Events, and Stat Activity, make PGWatch easy to operate:

Global Health - PGWatch
Server Log Events - PGWatch
Stat Activity - PGWatch

PGWatch Quickstart Guide:

  1. Start the Docker image with “docker run -d -p 3000:3000 -p 8080:8080 –name pw2 cybertec/pgwatch2”
  2. Add your database to monitor it via management interface on port 8080
  3. Wait a few minutes for the daemon to fetch data and then open Grafana on port 3000
  4.  ENJOY!

Need further assistance? Contact us!

PGWatch Download

The newest version of PGWatch can be downloaded directly from pgwatch.com

Or get it from our GitHub page:

CYBERTEC Logo white
CYBERTEC PostgreSQL International GmbH
Römerstraße 19
2752 Wöllersdorf
Austria

+43 (0) 2622 93022-0
office@cybertec.at

Get the newest PostgreSQL Info & Tools


    This site is protected by reCAPTCHA and the Google Privacy Policy & Terms of Service apply.

    ©
    2024
    CYBERTEC PostgreSQL International GmbH
    phone-handsetmagnifiercrosscross-circle linkedin facebook pinterest youtube rss twitter instagram facebook-blank rss-blank linkedin-blank pinterest youtube twitter instagram