PostgreSQL 18 is around the corner and it is time to take a look at one of the most important improvements that have been added to the core engine. We are of course talking about the introduction of asynchronous I/O (AIO), which has been a huge topic over the years.
Table of Contents
Let's dive into this and understand what the fuzz is all about. The standard I/O model works roughly like this:
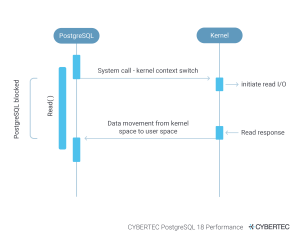
PostgreSQL opens a file and reads one 8k block after the other. Yes, the kernel will do readahead and so on, but essentially the process is:
This process is repeated. In real life, this means that the database cannot do calculations while we are waiting for the data to arrive. That is the curse of synchronous I/O. So, wouldn’t it be cool if the OS could already produce the data while the database is doing its calculations? The goal of AIO is to make reading and processing happen in parallel.
Here is a picture that illustrates this in more detail:
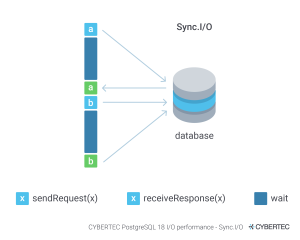
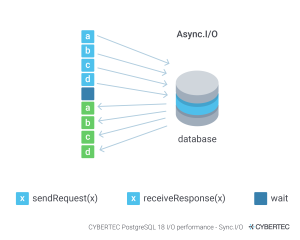
How does this work? The database schedules I/O and asks to provide it for later use. In the meantime, processing of already existing data can happen. This greatly reduces the latency the system will face. Obviously this is not beneficial to all operations, but it can greatly speed up things such as sequential scans, bitmap scans and so on.
In reality, one can expect better I/O performance - especially when running large scale operations.
However, let us not stick to theoretical explanations and move on to a more practical showcase.
The first thing one can do in PostgreSQL 18 and beyond is to actually configure the I/O method we are looking at. Here is how it works:
PostgreSQL 18 supports three I/O modes:
The parameter in use here is io_method, which can be found in postgresql.conf. We recommend using io_uring for maximum efficiency.
For the purpose of this test we will simply use pgbench, which can provide us with a simple enough data set for the tests we want to perform. In this example, we will use pgbench to initialize a database called “bench”, which will be roughly 1 TB in size:
|
1 2 3 4 5 6 7 8 9 10 11 12 13 14 15 16 17 18 19 20 21 22 23 24 25 26 27 |
hs@fedora:$ time pgbench -i bench -s 75000 dropping old tables... NOTICE: table "pgbench_accounts" does not exist, skipping NOTICE: table "pgbench_branches" does not exist, skipping NOTICE: table "pgbench_history" does not exist, skipping NOTICE: table "pgbench_tellers" does not exist, skipping creating tables... generating data (client-side)... vacuuming... creating primary keys... done in 12814.15 s (drop tables 0.00 s, create tables 0.03 s, client-side generate 8285.35 s, vacuum 4.17 s, primary keys 4524.61 s). real 213m34,164s user 27m2,342s sys 1m46,958s |
The “-s” parameter says that we want to produce 75000 times x 100k rows in our sample database.
Note that we are running the test on a local NVME disk on a Fedora Linux box:
|
1 2 3 4 5 6 7 8 9 10 11 12 13 14 15 16 17 |
bench=# \d+ List of relations Schema | Name | Type | Owner | Persistence | Access method | Size --------+------------------+-------+-------+-------------+---------------+-------- public | pgbench_accounts | table | hs | permanent | heap | 938 GB public | pgbench_branches | table | hs | permanent | heap | 2688 kB public | pgbench_history | table | hs | permanent | heap | 0 bytes public | pgbench_tellers | table | hs | permanent | heap | 32 MB (4 rows) |
The table that is ideal for the I/O test is the first one in the list. It is sufficiently big to not fit into memory and provides us exactly what we need: The chance to run a big fat simple sequential scan on a large table.
But let us check the desired configuration first:
|
1 2 3 4 5 6 7 8 9 |
bench=# SHOW io_method ; io_method ----------- io_uring (1 row) |
The most simplistic query that forces PostgreSQL to read the entire table might be as follows: We simply count the number of entries in the “bid” column of our big table. There is no index on this column and therefore the system will trigger a parallel sequential scan. The following listing shows the execution plan of our SQL statement:
|
1 2 3 4 5 6 7 8 9 10 11 12 13 14 15 16 17 18 19 20 21 22 23 24 25 |
bench=# explain SELECT count(bid) FROM pgbench_accounts; QUERY PLAN ---------------------------------------------------------------------------------------------- Finalize Aggregate (cost=162014321.55..162014321.56 rows=1 width=8) -> Gather (cost=162014321.33..162014321.54 rows=2 width=8) Workers Planned: 2 -> Partial Aggregate (cost=162013321.33..162013321.34 rows=1 width=8) -> Parallel Seq Scan on pgbench_accounts (cost=0.00..154200821.07 rows=3125000107 width=4) JIT: Functions: 5 Options: Inlining true, Optimization true, Expressions true, Deforming true (8 rows) Time: 9,635 ms |
Let us just run it and see what happens:
|
1 2 3 4 5 6 7 8 9 10 11 |
bench=# SELECT count(bid) FROM pgbench_accounts; count ------------ 7500000000 (1 row) Time: 288458,463 ms (04:48,458) |
The query takes almost 5 minutes. When looking at the I/O throughput of our disk, we can see that the disk peaks around 3.4 GB / sec (the “bi” column in the next listing contains the real system data represented as a 2 second average):
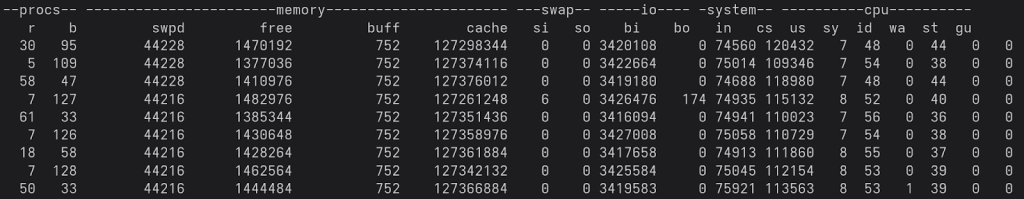
It is also noteworthy that the “wa” column (“disk wait”) is around 40. During the execution, one can see that PostgreSQL will use up around 3 cores and keep the disk totally busy.
To see what is going on during asynchronous reads, PostgreSQL offers a couple of new functions, which allow us to inspect how much I/O has been scheduled and what is going on in general. The first thing to look at is the pg_get_aios() function, which returns some insights:
|
1 2 3 4 5 6 7 8 9 |
bench=# SELECT count(*) FROM pg_get_aios(); count ------- 36 (1 row) |
On my local machine, the return value happened to be around 30 and 50 given 2 parallel worker processes. However, this number can of course vary depending on hardware, configuration, structure of your data and a lot more.
Of course, we can also take a deeper look at the data returned by the SFR (“set returning function”):
|
1 2 3 4 5 6 7 8 9 10 11 12 13 14 15 16 17 18 19 20 21 22 23 24 25 26 27 28 29 30 31 32 33 34 35 36 37 38 39 40 41 42 43 44 45 46 47 48 49 50 51 52 53 54 55 56 57 58 59 60 61 62 63 64 65 66 67 68 69 |
bench=# \x Expanded display is on. bench=# SELECT * FROM pg_get_aios() LIMIT 3; -[ RECORD 1 ]---+----------------------------------------------------- pid | 9665 io_id | 64 io_generation | 33591 state | SUBMITTED operation | readv off | 532152320 length | 131072 target | smgr handle_data_len | 16 raw_result | result | UNKNOWN target_desc | blocks 25755072..25755087 in file "base/16414/16430" f_sync | f f_localmem | f f_buffered | t -[ RECORD 2 ]---+----------------------------------------------------- pid | 9665 io_id | 65 io_generation | 33500 state | SUBMITTED operation | readv off | 531890176 length | 131072 target | smgr handle_data_len | 16 raw_result | result | UNKNOWN target_desc | blocks 25755040..25755055 in file "base/16414/16430" f_sync | f f_localmem | f f_buffered | t |
For every I/O request PostgreSQL has scheduled, we will get one entry so that we can understand exactly what is going on behind the scenes.
What is interesting to see here is: Regardless of the number of worker processes (assuming max_parallel_workers_per_gather is at least 2) the throughput on disk won’t change anymore because we have simply hit the limit of what the disk is able to handle. We are simply completely I/O bound already.
Back in the old days, all we had was synchronous I/O, and the new behavior is cutting edge. So let us compare the old and new technology by setting “io_method = sync”, which is what we had in PostgreSQL 17 and before:
|
1 2 3 4 5 6 7 8 9 10 11 |
bench=# SELECT count(bid) FROM pgbench_accounts; count ------------ 7500000000 (1 row) Time: 368744,007 ms (06:08,744) |
The changes are substantial: We top out at 2.6 GB already, which is roughly 800 MB / sec less than before. To get closer to what is doable, we have to raise the number of worker processes to somehow compensate for this:
|
1 2 3 4 5 6 7 8 9 10 11 12 13 14 15 16 17 |
bench=# SET max_parallel_workers_per_gather to 8; SET Time: 0,147 ms bench=# SELECT count(bid) FROM pgbench_accounts; count ------------ 7500000000 (1 row) Time: 288192,030 ms (04:48,192) |
In other words: We have to throw additional CPUs at the problem to make better use of the disk as such. When we take a look at “vmstat 2 -w”, there is something worth noticing:
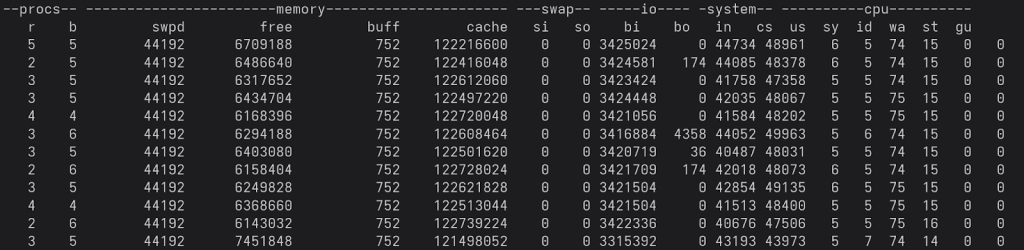
The disk wait has gone up substantially - we are now at around 75 instead of 40, which of course has a couple of implications that can affect the rest of your system in a fairly significant way.
Visualizing the results can give us a feeling of what we are dealing with:
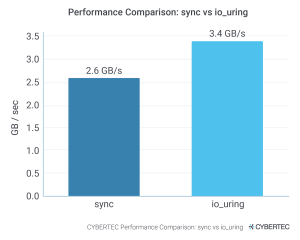
Now, with faster (or more) disks, we can see even higher differences and bigger gains. However, what is already pretty evident is: “PostgreSQL 18 makes significantly better use of your hardware” - especially if you are running on premise.

Leave a Reply