pg_watch is a metrics collector and visualization solution for PostgreSQL databases. It was developed by CYBERTEC. This flexible, self-contained PostgreSQL monitoring tool brings your database monitoring to the next level.
Although there are many PostgreSQL monitoring solutions, most of them are too complex to set up, and too inflexible – they do not allow you to extend their functionality on your own. pg_watch changes all that by providing high flexibility, and by focusing solely on metrics gathering. The presentation side is left to the best dashboarding tool available.
pg_watch works as a remote metrics-gathering daemon, periodically connecting to the database as a normal user would, and reading out metrics provided by the Postgres statistics subsystem. This has the advantage that you don’t need any special user rights and you don’t have to install any extensions on the database server itself, making use in restricted environments (e.g. AWS RDS) possible.
Visit our official website pgwatch.com for further information and instant downloading or read below for more details about pgwatch for enterprise-grade solutions.
We’ve built pg_watch with scale-up in mind – it’s perfect for monitoring large infrastructures. If you represent a large-scale enterprise, pgwatch is the right monitoring solution for you.
pg_watch can be run for thousands of systems
We have tested pgwatch on large-scale systems and have gathered a large amount of field experience with it. If you want to monitor thousands of systems, pgwatch is certainly the tool you should use. If you want to use pg_watch for your setup, get in touch with us to find out more.
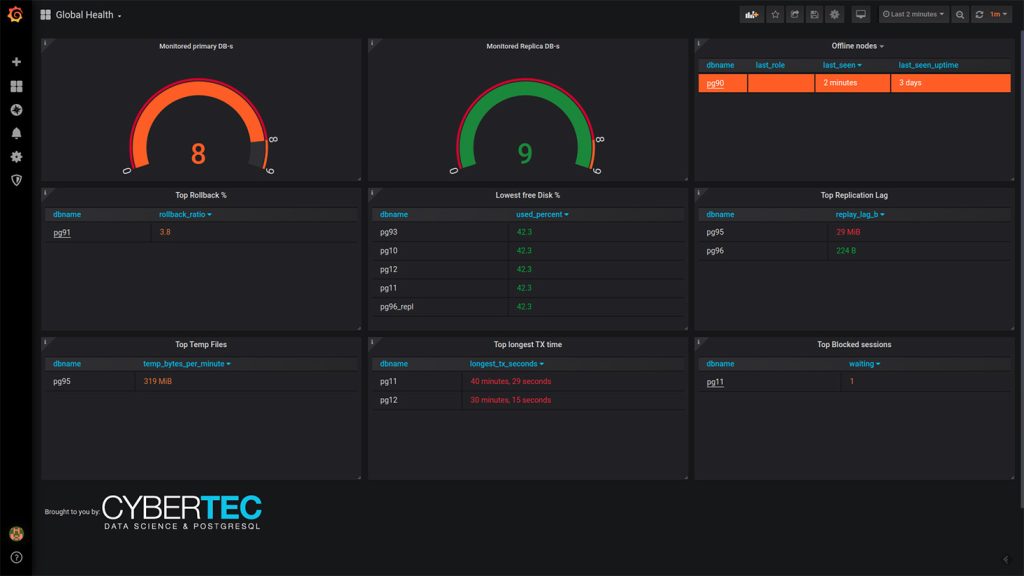
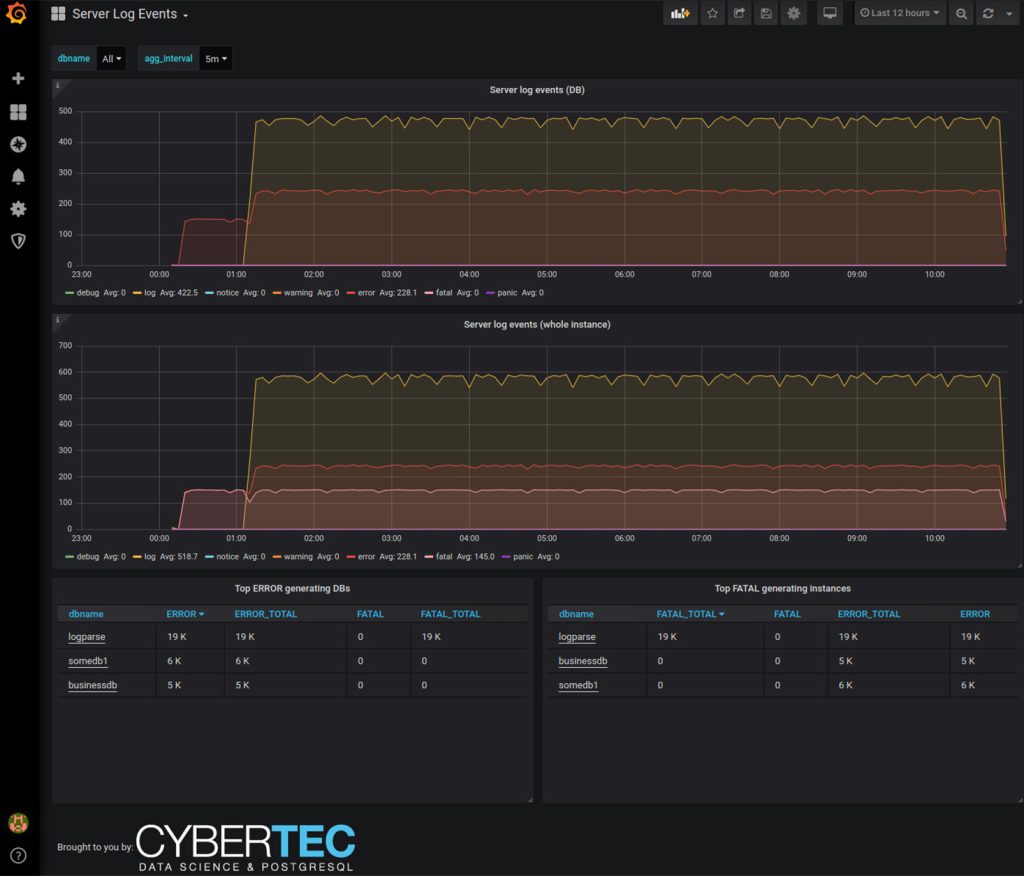
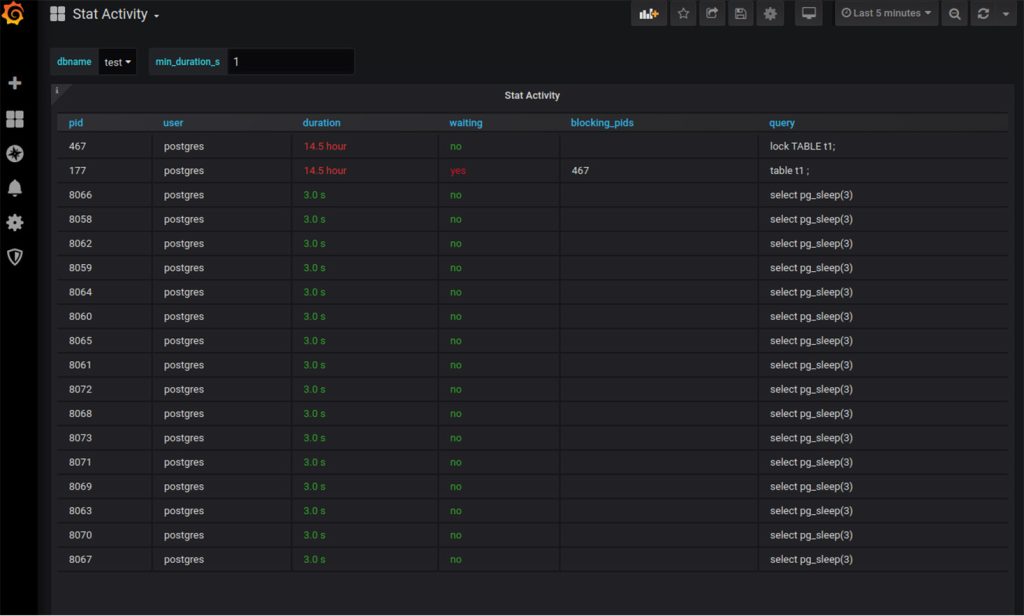
Logically arranged dashboards, i.e. for Global Health, Server Log Events, and Stat Activity, make pg_watch easy to operate:


Need further assistance? Contact us!
The newest version of pg_watch can be downloaded directly from pgwatch.com
Or get it from our GitHub page:
+43 (0) 2622 93022-0
office@cybertec.at
You are currently viewing a placeholder content from Facebook. To access the actual content, click the button below. Please note that doing so will share data with third-party providers.
More InformationYou are currently viewing a placeholder content from X. To access the actual content, click the button below. Please note that doing so will share data with third-party providers.
More Information