Recently a great presentation “1000x: The Power of an Interface for Performance” from Joran Dirk Greef from TigerBeetle made the rounds. If I may summarize, the gist of the presentation was that the correct programming model can mean many orders of magnitude performance difference. As the presentation did not explore this, I wanted to see how far we get by adjusting our programming style on boring old relational databases.
Table of Contents
As my aim is not to engage in competitive benchmarking I will not try to reproduce the exact benchmark used in the talk. Rather I will be using our trusty old pgbench, which implements workload described in TPC-B. Not at all coincidentally, this is almost exactly Jim Gray’s DebitCredit workload referenced in the talk. Here is the benchmark script used:
|
1 2 3 4 5 6 7 8 9 10 11 12 |
\set aid random(1, 100000 * :scale) \set bid random(1, 1 * :scale) \set tid random(1, 10 * :scale) \set delta random(-5000, 5000) BEGIN; UPDATE pgbench_accounts SET abalance = abalance + :delta WHERE aid = :aid; SELECT abalance FROM pgbench_accounts WHERE aid = :aid; UPDATE pgbench_tellers SET tbalance = tbalance + :delta WHERE tid = :tid; UPDATE pgbench_branches SET bbalance = bbalance + :delta WHERE bid = :bid; INSERT INTO pgbench_history (tid, bid, aid, delta, mtime) VALUES (:tid, :bid, :aid, :delta, CURRENT_TIMESTAMP); END; |
The important tunable parameter here is the scale factor. This determines the size of the database - about 17MB per increment - but also the number of branches. The general wisdom is that one shouldn’t benchmark the database with a low scale factor, because then you get bad performance due to contention. But bad performance due to contention on hot rows is exactly what happens in real world transaction systems. So instead of increasing the scale factor, I’m going to keep it at 10 to have something equivalent to 10% contention, and will look into increasing performance using other means.
The benchmark was done using PostgreSQL 18 running on Ryzen 9 9900X and a Samsung 990 Pro NVMe drive. The only tuning to PostgreSQL is to bump up shared buffers to 2GB so the whole dataset fits in and increasing max_connections to 1000 to be able to run the test. Details of the machine will not be particularly important for the big picture, but just for reference, the CPU is maybe twice as fast than most encountered in the cloud, but the disk has a fdatasync latency of 1.2ms, about twice slower than a typical cloud drive.
If we run this benchmark for 300 seconds using a variable number of local socket connections we end up with the following scaling behavior (note the logarithmic x axis):
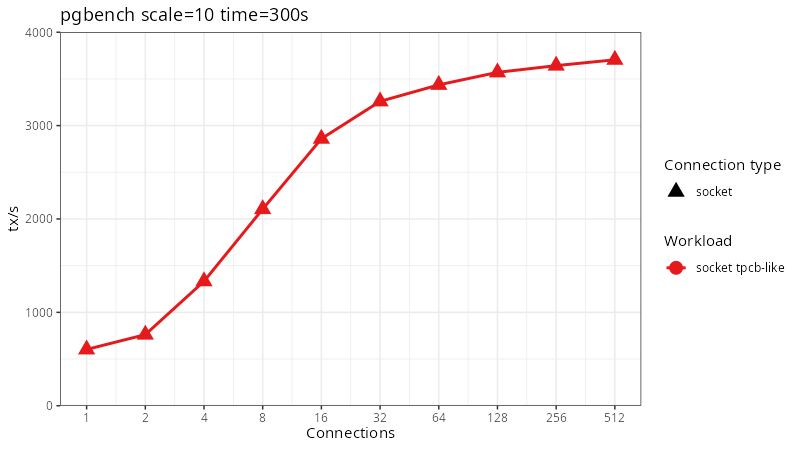
Our throughput generally scales fine until about 16 connections and then we hit a point of diminishing returns, managing 3700 tx/s with 512 clients. The CPU during this benchmark is almost completely idle. We can use pg_wait_sampling to take a look at wait events during the benchmark. The top 5 wait events are:
|
1 2 3 4 5 6 7 8 9 10 11 12 |
Wait event | Percent of load | load --------------------------+-----------------+-------- Lock/transactionid | 74.70 | 381.32 Lock/tuple | 21.94 | 111.97 LWLock/WALWrite | 1.58 | 8.08 LWLock/LockManager | 0.76 | 3.89 On CPU | 0.40 | 2.04 Client/ClientRead | 0.39 | 1.99 IO/WalSync | 0.19 | 0.98 LWLock/BufferContent | 0.03 | 0.14 LWLock/WALInsert | 0.00 | 0.02 IPC/ProcarrayGroupUpdate | 0.00 | 0.01 |
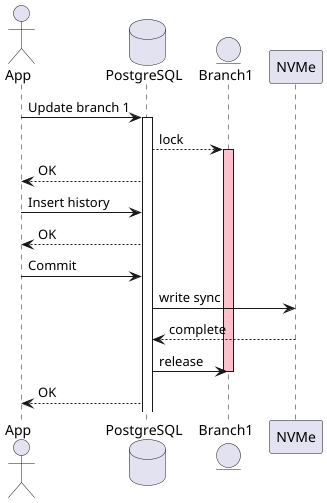
We can see that the top events are Lock/transactionid and Lock/tuple. The distinction between the two is not really important right now, but both happen when trying to update a row that has been updated by an in-progress transaction. So almost everybody is waiting for a previous transaction to complete before they can proceed.And what is that previous transaction doing? On average 1 transaction is writing WAL to make their commit record durable and 8 more are waiting for that one to complete so they get their turn. PostgreSQL WAL writing currently can only have one write I/O in flight.
We can check if the numbers make sense. A transaction updating one of the contended branches table rows will lock the row until it completes and writes WAL to disk. Because we don’t want users to observe “ghost transactions” that disappear, we can't let them see this transaction until it is made durable. While this is happening other transactions updating other rows will also complete and will queue up for their turn to write WAL. When the first one completes the queued ones will all flush at once, while the now unblocked transaction will form the next queue. This lock-step will repeat, at best flushing about half of the branches table worth of transactions each cycle. With 10 rows in the branches table and a 1.2ms WAL flush latency we can expect to see at best 10 / 2 / 0.0012s = 4167 tx/s. This first order approximation is not too far off from the observed performance.
But this benchmark is running over a local socket - an almost infinitely fast network. I wanted to explore what happens with a slower network. The talk used a 1ms latency network, but I will jump directly to 10ms. To get better contrast, but also because my disk is relatively slow. A proper enterprise NVMe drive can be 10x faster or more. 10ms is a typical neighboring country/state latency.
On Linux it’s possible to set up a virtual network interface pair that has a delay. I used the following for this setup:
|
1 |
tc qdisc change dev veth0 root netem delay 10ms |
What does 10ms do to our performance?
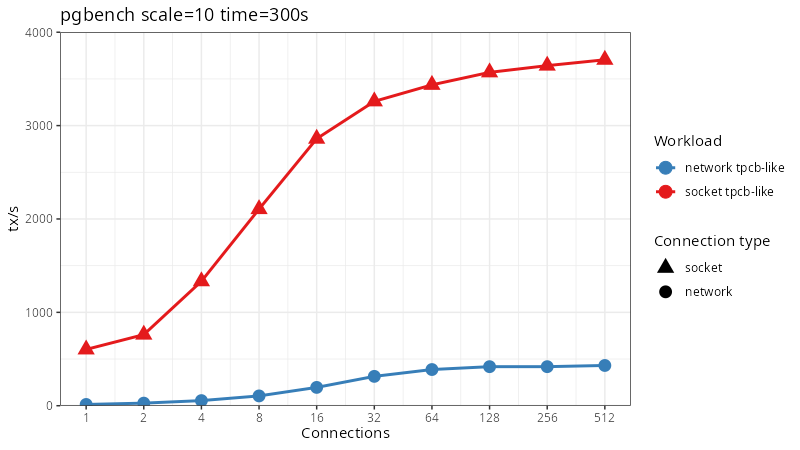
Yikes! Now our throughput starts at a whopping 13.6 tps instead of the earlier 600 tps. And even when scaled all the way up to 512 clients we only get 431 tps.
The cause here is the programming model of SQL. SQL is defined as an interactive protocol. In a transaction the client sends a query to the server, the server does the work, sends a response back and then asks the client what it wants to do next.
In other words, the control flow for a transaction is running on one machine and the data processing on a different machine. In our case, this means that during the performance critical section of holding the lock for a branch we go back and forth over the network not once, but twice. In this case the absolute best performance we could expect to see is 10/(2*10ms + 1.2ms) = 470 tps, approximately matching what we are seeing in practice.
If you’re thinking that this is insane, you are quite right. We can definitely do better. One of those ways is to move the control loop over to the database size. The traditional way to have imperative logic in the database is using stored procedures. Coincidentally, a thread to add this capability to pgbench was recently revived. In the toy benchmark that is TPC-B there is not any actual logic so we could have gotten away with something as simple as a common table expression too. But plpgsql has already been implemented I am going to use that. The results would be quite similar either way.
The server side function used to drive the logic looks like this:
|
1 2 3 4 5 6 7 8 9 10 11 12 13 |
CREATE OR REPLACE FUNCTION public.pgbench_tpcb_like(_aid integer, _bid integer, _tid integer, _delta integer) RETURNS void LANGUAGE plpgsql AS $ BEGIN UPDATE pgbench_accounts SET abalance = abalance + _delta WHERE aid = _aid; PERFORM abalance FROM pgbench_accounts WHERE aid = _aid; UPDATE pgbench_tellers SET tbalance = tbalance + _delta WHERE tid = _tid; UPDATE pgbench_branches SET bbalance = bbalance + _delta WHERE bid = _bid; INSERT INTO pgbench_history (tid, bid, aid, delta, mtime) VALUES (_tid, _bid, _aid, _delta, CURRENT_TIMESTAMP); END; $; |
And the benchmark script itself gets simplified to:
|
1 2 3 4 5 |
\set aid random(1, 100000 * :scale) \set bid random(1, 1 * :scale) \set tid random(1, 10 * :scale) \set delta random(-5000, 5000) SELECT 1 FROM pgbench_tpcb_like(:aid, :bid, :tid, :delta); |
Basically it has just moved the statements from a client script to a server side function verbatim and created a function signature to execute this whole transaction. In a real application there is likely to be some actual conditional logic and output data, so the work will not be as straightforward. But this work only needs to be done for the critical transactions that update highly contended rows.
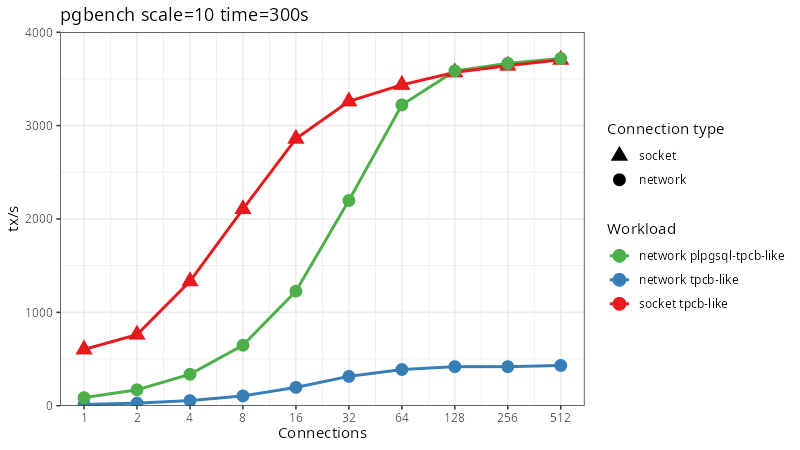
Much better! At low concurrencies, most of the database time is spent idle while requests and responses traverse their way across the network - each connection can execute at most 100 transactions per second. If we keep increasing the number of clients eventually we will hit the same limit as the local socket benchmark. Nice to see this, but it is still quite a long way off from the types of numbers TigerBeetle was posting. Can we appropriate some other techniques that they use?
Indeed we can. The technique we need is batching. The primary bottleneck is that we can handle only one update to branch during one cycle of flushing WAL to disk, in practice more like one update per two flushes. But if we put multiple updates into a single transaction we should be able to see a corresponding increase in performance as each flush will be persisting the information for many updates.
Now, we have to be careful with those updates. A naive implementation will just deadlock on almost every transaction. The trick to avoiding deadlocks is to make sure that two transactions that need the same locks will acquire them in the same order. In our case it is enough to sort the updates, doing each table as a separate step. Here is the function doing this. It might look complicated at first glance, but it’s a straightforward transformation of the previous one. Changing all parameters to be arrays, and each update statement preprocesses the input as a subquery to merge duplicates and order the updates.
|
1 2 3 4 5 6 7 8 9 10 11 12 13 14 15 16 17 18 19 20 21 22 23 24 25 26 27 28 |
CREATE OR REPLACE FUNCTION pgbench_transaction_array(p_aid int[], p_bid int[], p_tid int[], p_delta int[]) RETURNS int[] AS $ DECLARE balances int[]; BEGIN UPDATE pgbench_accounts SET abalance = abalance + delta FROM (SELECT _aid, sum(delta) delta FROM unnest(p_aid, p_delta) t(_aid, delta) GROUP BY _aid ORDER BY _aid) WHERE aid = _aid; SELECT array_agg(abalance) INTO balances FROM pgbench_accounts WHERE aid = ANY (p_aid); UPDATE pgbench_tellers SET tbalance = tbalance + delta FROM (SELECT _tid, sum(delta) delta FROM unnest(p_tid, p_delta) t(_tid, delta) GROUP BY _tid ORDER BY _tid) WHERE tid = a; UPDATE pgbench_branches SET bbalance = bbalance + delta FROM (SELECT _bid, sum(delta) delta FROM unnest(p_bid, p_delta) t(_bid, delta) GROUP BY _bid ORDER BY _bid) WHERE bid = a; INSERT INTO pgbench_history (tid, bid, aid, delta, mtime) SELECT tid, bid, aid, delta, CURRENT_TIMESTAMP FROM unnest(p_tid, p_bid, p_aid, p_delta) as t(tid,bid,aid,delta); RETURN balances; END; $ LANGUAGE plpgsql; |
Unfortunately pgbench scripts are not flexible enough to generate the array parameters as needed, so for this step I needed to whip together a quick custom benchmark runner. I will spare you the full details of the runner itself. It’s a Python script that fires up a set of threads to execute batches of transactions in a loop until allotted time expires and counts up how many transactions got executed. The core function to run the transaction looks like this:
|
1 2 3 4 5 6 7 8 |
def execute_transaction(self, cur): aids = [random.randint(1, total_aids) for _ in range(batch_size)] tids = [random.randint(1, total_tids) for _ in range(batch_size)] bids = [random.randint(1, total_tids//10) for _ in range(batch_size)] deltas = [random.randint(-5000, 5000) for _ in range(batch_size)] cur.execute("SELECT pgbench_transaction_array(%s, %s, %s, %s)", (aids, bids, tids, deltas)) |
For batch size I intuited 1000 transactions - about 100 for each branch in each batch should be enough to amortize overheads to be negligible. And if we look at the results it is indeed so.
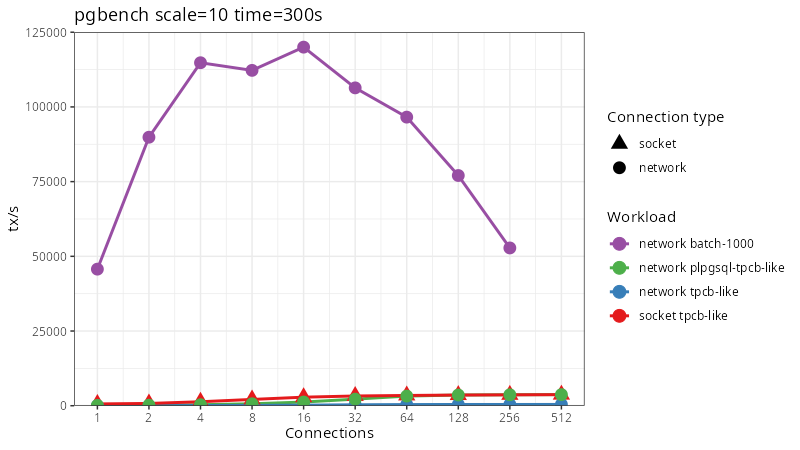
I had to rescale the y axis by quite a bit as even with one connection we are able to push through more than an order of magnitude more transactions than even the best case was able earlier. Implementing the two architectural patterns that TigerBeetle uses in a RDBMS we are able to get similar orders of magnitude of performance improvement they demonstrated.
So what did we learn from this exercise? When we have fundamentally contended updates we need to restructure the problem so that the core loop updating the contended state is as tight as possible. If at all possible, even syncing things to disk should be hoisted outside of the loop using techniques like batching. And most definitely we don’t want to run our transaction logic on one server and locking and data access on another one with a long network delay between every operation. This is no longer pgbench, but that is fine, nobody has said that business transactions must match database transactions 1:1.
The quick and dirty benchmark setup I did here did not include synchronous replication, something that any production transaction processing solution should include. As things stand in PostgreSQL today, that would add one primary-replica network roundtrip and one or two disk roundtrips to the lock hold times. This would have cut peak performance of unbatched workloads by more than half. It is something that PostgreSQL could improve, but that discussion is something for a future blogpost.

Leave a Reply