PostgreSQL has tons of useful features and so it is somehow inevitable that some of it gets forgotten every now and then. In my case that's exactly what happens a lot with a cool piece of functionality called “auto_explain”, which is a module in the contrib package. So I thought I'll just write a short reminder to my future self and potentially also some other people out there who occasionally have the problem of fitting the working set to the main memory 😉
From the excellent PostgreSQL documentation we can read:
"The auto_explain module provides a means for logging execution plans of slow statements automatically, without having to run EXPLAIN by hand. This is especially helpful for tracking down un-optimized queries in large applications."
Sounds pretty useful, right? One only needs to keep in mind that all the features come at a certain cost. So the hint from the documentation is that the approach falls a bit into the category “let's bring out the big guns”, and probably doesn't make a lot of sense. So if everything is running fine and there is no need to pay that small extra execution penalty. But if you're experiencing sporadic slow statements in the database log from your applications sessions (given log_min_duration_statement is set accordingly) but can't really pinpoint the problem from re-running those slow statements with manual explains (the rows with those ID's from the query are gone or data distribution has changed), enabling this extension could provide you some helpful insights.
The basic setup is pretty simple actually, just modify postgresql.conf to set the “auto_explain.log_min_duration” parameter to your “allowed pain-threshold” value , e.g. '5s' and enable the library for all sessions by setting "shared_preload_libraries = auto_explain". Then restart your database, and voila – execution plans of all statements that take more than 5 seconds will be logged. A tip - the module could also be configured on user level if you're really conscious about performance.
For some more advanced usecases, even more configuration parameters exist – logically all the extra options for the standard EXPLAIN (verbosity, buffers, timing information, output format) can be enabled plus additionally the more exotic possibilities of including detailed trigger execution timing and sub statement "explain" information for stored procedures.
Log entry including trigger execution statistics would look something like that for my simple test scenario. Code here.
|
1 2 3 4 5 6 |
STATEMENT: insert into t1 select 1; LOG: duration: 1001.976 ms plan: Query Text: insert into t1 select 1; Insert on t1 (cost=0.00..0.01 rows=1 width=0) (actual time=0.048..0.048 rows=0 loops=1) -> Result (cost=0.00..0.01 rows=1 width=0) (actual time=0.001..0.001 rows=1 loops=1) Trigger t1_upd_trg: time=1001.924 calls=1 |
We recently published a patch to provide full database encryption for PostgreSQL. Many business-critical applications require full encryption to match legal or business requirements. As more and more customers asked for this, we decided to tackle this important issue. The idea behind our patch is to store data on disk in encrypted format and decrypt blocks as they are read from disk into shared buffers. As soon as a block is written to disk again, it will be encrypted automatically. Note that the entire instance is encrypted.
Our patch can be downloaded here.
The idea is to make the setup process easy to understand. In addition to that it has to be secure. For our WIP patch we decided to use environment variables to store the key itself:
|
1 2 |
export PGENCRYPTIONKEY=abcdef initdb -k -K pgcrypto /data/dbencrypt/ |
The key has to be provided before initdb otherwise the instance cannot be created.
While database side encryption makes sure that data is stored safely on the node, it does have some impact on performance. To figure out how large the impact might be I decided to run some simple tests showing what is going on.
For a start I decided to try the normal pgbench stuff on my laptop. This should be enough to get an overall idea. Here is what I did:
|
1 2 |
createdb test pgbench -s 10 -i test |
First of all I created a database and a test database containing 1 million rows. To make sure that disk flushes don't destroy our data I set synchronous_commit to off. This should greatly reduce the number of disk flushes so we should get a clear picture:
|
1 2 3 |
test=# ALTER DATABASE test SET synchronous_commit TO off; ALTER DATABASE |
I ran the following benchmark to compare the results:
|
1 |
pgbench -c 4 -T 60 -S test |
4 concurrent threads hammered the database for a minute (read only). As expected the results depend very much on the configuration of PostgreSQL. Remember, a block has to be encrypted when it goes to disk and decrypted when it is fetched from the kernel. Naturally small values for shared_buffers tend to ruin performance while large shared_buffers settings tend to be very beneficial for encryption.
Here are the results:
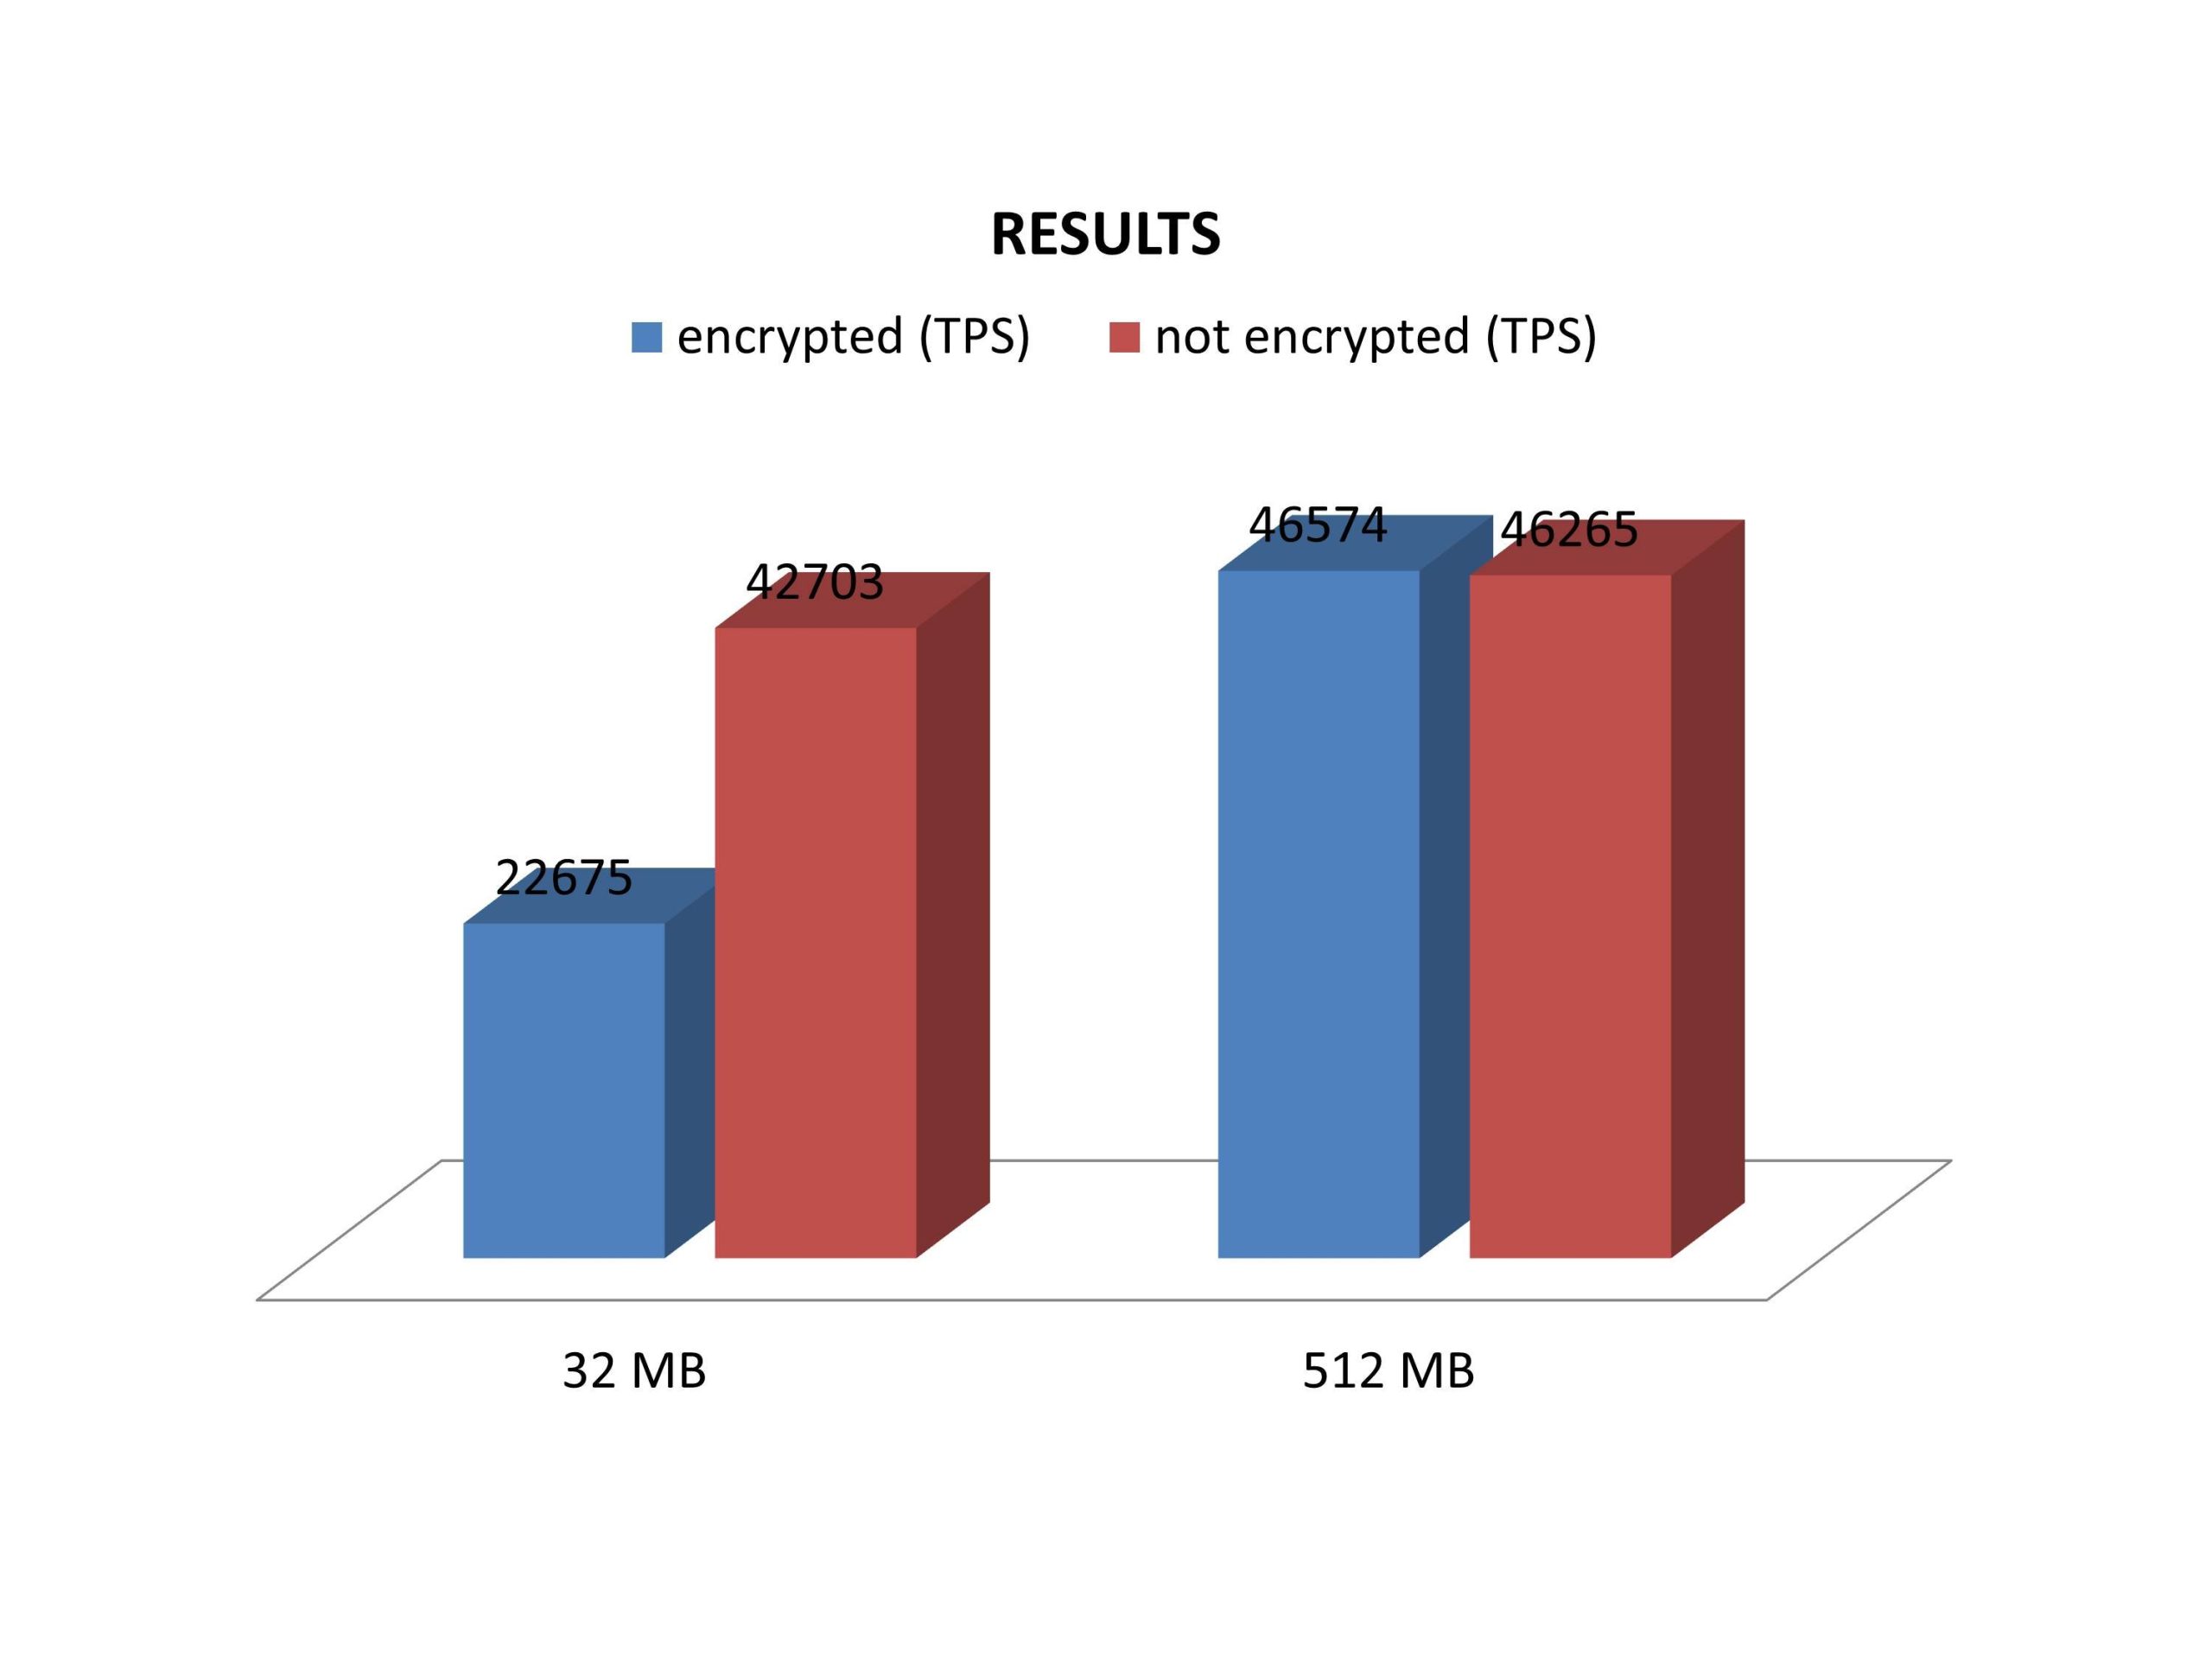
The data set we are using here is around 130 MB in size, so that quite some time is wasted during encryption and decryption. Naturally the difference decreases as more memory is added. As soon as the entire database fits into memory the performance difference will drop to close to zero as expected.
The current AES-implementation is not too great, however.
We have a prototype AES-NI implementation that does 3GB/s per core on a Haswell based system (1.25 B/cycle). Intel offers some very nice hardware support for encryption, so this is surely the way to go.
In order to receive regular updates on important changes in PostgreSQL, subscribe to our newsletter, or follow us on Facebook or LinkedIn.
Since BRIN indexes have been introduced in PostgreSQL 9.5, many people have gladly adopted this new index type. A lot has been written about this new feature and a lot of positive feedback has been reported. While BRIN indexes are clearly a success and definitely a win, some people tend to exaggerate and use them far too frequently.
BRIN indexes are cheap, but this does not mean that they are always beneficial. In case the correlation of a column is low, BRIN indexes can be no gain or even a small loss.
|
1 2 3 4 5 6 7 8 9 10 11 12 13 14 15 |
test=# CREATE TABLE t_test AS SELECT * FROM generate_series(1, 1000000) AS id; SELECT 1000000 Time: 422.647 ms test=# VACUUM ANALYZE t_test; VACUUM Time: 144.370 ms |
We generate a PostgreSQL table containing 1 million lines.
|
1 2 3 4 5 6 7 8 9 |
test=# SELECT count(*) FROM t_test WHERE id = 533455; count ------- 1 (1 row) Time: 44.555 ms |
The sequential scan takes around 44 ms and returns exactly one row.
|
1 2 3 4 5 6 7 8 9 10 11 12 |
test=# CREATE INDEX idx_brin ON t_test USING brin(id); CREATE INDEX Time: 148.036 ms test=# SELECT count(*) FROM t_test WHERE id = 533455; count ------- 1 (1 row) Time: 2.983 ms |
In this case, the scan is a lot faster and completes within around 3 ms. That's pretty nice.
|
1 2 3 4 5 6 7 8 9 10 11 12 13 14 15 16 17 18 |
test=# explain analyze SELECT count(*) FROM t_test WHERE id = 533455; QUERY PLAN ------------------------------------------------------------------------------------------------ Aggregate (cost=16.02..16.03 rows=1 width=8) (actual time=2.514..2.514 rows=1 loops=1) Bitmap Heap Scan on t_test (cost=12.01..16.02 rows=1 width=0) (actual time=1.228..2.511 rows=1 loops=1) Recheck Cond: (id = 533455) Rows Removed by Index Recheck: 28927 Heap Blocks: lossy=128 Bitmap Index Scan on idx_brin (cost=0.00..12.01 rows=1 width=0) (actual time=0.029..0.029 rows=1280 loops=1) Index Cond: (id = 533455) Planning time: 0.059 ms Execution time: 2.541 ms (9 rows) |
As you can see, PostgreSQL does a bitmap scan to fetch the data. The number of blocks read is 128 (exactly the desired number of blocks).
However, the situation is quite different in case correlation goes down. Remember: A normal BRIN index calculates the minimum and the maximum value in a range of 128 blocks. In case data is sorted the index performs nicely because many 128 x 8k areas can be excluded from the scan.
The situation changes dramatically if the data is shuffled (= correlation is low). In this case, a chunk of 128 blocks (= 1 MB) will most likely contain a value close to the absolute minimum and the absolute maximum of the column.
|
1 2 3 4 5 6 7 8 9 10 |
test=# CREATE TABLE t_random AS SELECT * FROM t_test ORDER BY random(); SELECT 1000000 Time: 1321.911 ms test=# VACUUM ANALYZE t_random ; VACUUM Time: 146.827 ms test=# CREATE INDEX idx_brin_random ON t_random USING brin(id); CREATE INDEX Time: 140.131 ms |
|
1 2 3 4 5 6 7 8 9 10 11 12 13 14 15 16 17 18 19 20 21 22 23 |
test=# explain analyze SELECT count(*) FROM t_random WHERE id = 533455; QUERY PLAN -------------------------------------------------------------------- Aggregate (cost=16.02..16.03 rows=1 width=8) (actual time=86.122..86.122 rows=1 loops=1) Bitmap Heap Scan on t_random (cost=12.01..16.02 rows=1 width=0) (actual time=73.613..86.117 rows=1 loops=1) Recheck Cond: (id = 533455) Rows Removed by Index Recheck: 999999 Heap Blocks: lossy=4425 Bitmap Index Scan on idx_brin_random (cost=0.00..12.01 rows=1 width=0) (actual time=0.314..0.314 rows=44800 loops=1) Index Cond: (id = 533455) Planning time: 0.102 ms Execution time: 86.173 ms (9 rows) Time: 86.621 ms |
In this example, the query runtime skyrockets. So does the number of blocks needed.
BRIN indexes are only effective if a column is somewhat “sorted”. In many cases, this happens naturally. However, it is certainly not always the case.
In case you need any assistance, please feel free to contact us.
In order to receive regular updates on important changes in PostgreSQL, subscribe to our newsletter, or follow us on Facebook or LinkedIn.
With the launch of Postgres 9.5, a new setting called "wal_compression" was introduced, that should decrease the IO load on behalf of CPU load. That is a desirable compromise considering typical constraints of modern hardware. But somehow the feature didn't get the publicity it deserved - it wasn't even mentioned in the What's new roundup and by default it's turned off. So I thought I'll try to broadcast the message out again and provide a simple test scenario to highlight the benefits.
First, we'll run the small script you can find below (for the "do try this at home" folks out there) in two versions, with wal_compression "on" and "off" accordingly. Testing scenario itself is pretty simple, we rely on our good old friend pgbench again. First we initialize the pgbench schema with a "scale" value of 100, translating into 10 Mio rows in the main "pgbench_accounts" table and at about 1.3 GB of "on disk" size. Then we do a short benchmark run with 200k transactions. Default transactions in pgbench consist mostly of random updates over the whole primary key space.
Here we'll be only interested here though only in the written WAL size, and take a note of that after every step. One thing to notice here is that for the WAL-s to accumulate we'll need to set the wal_keep_segments (min_wal_size would do the trick also) to a high value, so that no WAL files would be recycled and we can measure write activity directly off the filesystem.
Here is our test script for WAL compression.
|
1 2 3 4 5 6 7 8 9 10 11 12 13 14 15 16 17 18 19 20 21 |
FOLDER=wal_compression WAL_COMPRESSION=off PORT=5433 SCALE=100 TX=100000 # per client. we use 2 clients echo 'running initdb...' initdb -D $FOLDER &>/dev/null OPTS=$(cat </dev/null echo 'size after testdata creation' du -b -s $FOLDER/pg_xlog pgbench -p $PORT -c 2 -j 2 -t $TX -M prepared &>/dev/null echo 'size after $TX transactions' du -b -s $FOLDER/pg_xlog pg_ctl -D $FOLDER stop #rm -rf $FOLDER |
After going through 2 runs I got the following numbers: 1st run, wal_compression = on
|
1 2 3 4 5 6 |
size after initdb 16785408 wal_compression2/pg_xlog/ size after testdata creation 1207967744 wal_compression2/pg_xlog size after 100000 transactions 1509957632 wal_compression2/pg_xlog |
2nd run, wal_compression = off
|
1 2 3 4 5 6 |
size after initdb 16785408 wal_compression3/pg_xlog/ size after testdata creation 1308631040 wal_compression3/pg_xlog size after 100000 transactions 2382381056 wal_compression3/pg_xlog |
Now let's do some calculations...
|
1 2 3 4 5 6 7 8 9 10 11 12 13 14 15 |
krl@postgres=# select (1308631040 - 1207967744 - 2*16785408) / (1207967744 - 16785408)::float; ?column? ──────────────────── 0.0563242737676056 (1 row) krl@postgres=# with q_no_comp_diff as (select 2382381056 - 1308631040 as value), q_comp_diff as (select 1509957632 - 1207967744 as value) select (q_no_comp_diff.value - q_comp_diff.value) / q_comp_diff.value::float from q_no_comp_diff, q_comp_diff; ?column? ────────────────── 2.55558268229167 (1 row) |
What we can see is that the size difference during initialization (sequential INSERTs) of the test schema yields a moderate ~6%, but random updates exhibit a whopping 255% difference in WAL written!
Ok, conclusion time. As we had a synthetic dataset we could say that if you're doing mostly random updates over the whole dataset, enabling wal_compression could bring you noticeable improvement in the form of: a replication lag decrease when the network between replicas is slow; disk space savings for your WAL archive when doing PITR; or most importantly, a general decrease of server disk IO contention. You should definitely give this setting a try! And the best part is that it's as easy as switching the flag in your config and restarting your server.
In case you need any assistance, please feel free to contact us.
Recently there have been a couple of very exhaustive and rather technical posts on Planet Postgresql on the topic of bloat. Bloat in short, for those new to Postgres, is an unescapable by-product of Postgres' excellent concurrency-enablement model called MVCC (multi-version concurrency control), that creates new copies of rows when you update data in a concurrent access scenario. In the long run this causes your tables (and also indexes) to use more disk space than they actually need to, especially when running busy multi-user applications where at times "autovacuum" cannot keep up with the amount of data changes.
But ok, let's leave out the deeper bloat and bloat fighting details (VACUUM FULL, CLUSTER, pg_repack) this time and concentrate on how can you actually quickly estimate if you indeed have a "bloat problem" on one of your tables?
There are 2 most common approaches here - to use a Postgres extension called "pgstattuple" (part of the official contrib modules) which includes a function named pgstattuple_approx() available since Postgres version 9.5 or to rely on a community developed pure SQL query where no setup is needed, and which works also for older versions. Community scripts can be found from Postgresql Wiki bloat page. There are couple of slightly different scripts around, I chose here the one redirecting us ultimately to a GitHub page here (thanks ioguix!). Both estimation methods do some educated guessing based on available statistics and have very low cost. For exact information on bloatedness the "pgstattuple" extension also has a pgstattuple() method that we will throw in for comparison, but this method possibly comes at high cost as it performs a full table scan.
So let's go forward and try to exemplify the process of bloat generation and then detection with our different estimation methods.
The big question first is - how to artificially generate bloat for our test purposes? Turns out it's not trivial.
For test data generation itself (UPDATE statements) we'll use the helpful command line performance testing tool "pgbench" that's included with standard Postgres installation. The tricky part though is that we need to ensure that old versions of updated rows wouldn't be cleaned up and marked for re-use during our test, thus not producing our wished bloat. One way to achieve that would be to turn off autovacuum in the postgresql.conf or per table basis with "ALTER TABLE SET (autovacuum_enabled = false)", but the easiest way in my opinion is to open a new parallel transaction in REPEATABLE READ mode beforehand and execute a data reading query under that session to make the transaction really active. This ensures that all the rows visible at that moment would be kept around until our "repeatable" transaction finishes. This method would also counter any possible HOT pruning (on-the-fly page level mini-vacuuming) scenarios for cases where updated fields have no indexes.
First, we'll set up the test schema with a scaling factor of 10, meaning 1 million bank accounts will be initialized in our selected test table called "pgbench_accounts". Then, we'll run 1 million account updates, which should double the table size and create a bloat ratio of 50%.
|
1 2 3 4 5 6 7 8 9 10 11 12 13 14 15 16 17 18 |
krl@r840:~$ pgbench -i -s10 pgbench creating tables... 100000 of 1000000 tuples (10%) done (elapsed 0.04 s, remaining 0.32 s) ........ 1000000 of 1000000 tuples (100%) done (elapsed 0.44 s, remaining 0.00 s) vacuum... set primary keys... done. pgbench=# dt+ List of relations Schema | Name | Type | Owner | Size | Description --------+------------------+-------+--------+---------+------------- public | pgbench_accounts | table | krl | 128 MB | public | pgbench_branches | table | krl | 40 kB | public | pgbench_history | table | krl | 0 bytes | public | pgbench_tellers | table | krl | 40 kB | (4 rows) |
Now let's execute our "vacuum stopper" query in another session, before we start our data update process.
|
1 2 3 4 5 6 |
krl@pgbench=# begin transaction isolation level repeatable read ; BEGIN krl@pgbench=#* select * from pgbench_accounts limit 1; aid │ bid │ abalance │ filler ─────┼─────┼──────────┼───────────────────────────────────────────────────────── 3 │ 1 │ 0 │ |
Here I'm using the 'prepared transaction' protocol for best performance and note that the --transactions flag is per client.
|
1 2 3 4 5 6 7 8 9 10 11 12 13 14 15 16 17 18 19 20 21 22 |
krl@r840:~$ pgbench --no-vacuum --client=2 --jobs=2 --transactions=500000 --protocol=prepared pgbench transaction type: TPC-B (sort of) scaling factor: 10 query mode: prepared number of clients: 2 number of threads: 2 number of transactions per client: 500000 number of transactions actually processed: 1000000/1000000 latency average: 0.000 ms tps = 1903.859294 (including connections establishing) tps = 1904.357546 (excluding connections establishing) krl@pgbench=# dt+ List of relations Schema │ Name │ Type │ Owner │ Size │ Description ────────┼──────────────────┼───────┼───────┼────────┼───────────── public │ pgbench_accounts │ table │ krl │ 256 MB │ public │ pgbench_branches │ table │ krl │ 35 MB │ public │ pgbench_history │ table │ krl │ 50 MB │ public │ pgbench_tellers │ table │ krl │ 42 MB │ (4 rows) |
Finished...and seems that our test table "pgbench_accounts" has indeed doubled in size.
For all provided functions take a look into the documentation - https://www.postgresql.org/docs/9.5/static/pgstattuple.html
For updating the internal statistics and freeing up old version of rows to help with the guesswork we also need to close our parallel session and run VACUUM ANALYZE.
|
1 2 3 4 5 6 |
krl@pgbench=#* rollback ; ROLLBACK krl@pgbench=# VACUUM ANALYZE pgbench_accounts; VACUUM krl@pgbench=# CREATE EXTENSION pgstattuple ; CREATE EXTENSION |
I've only selected most pertinent columns here and also added our table name to the WHERE clause of the community query to reduce noise.
NB! Note that in case of pgstattuple_approx() the scanned_percent value of 0 indicates that we indeed have an estimated value, thus under unfavourable conditions this function can still do table scans!
|
1 2 3 4 5 6 7 8 9 10 11 12 13 14 15 16 17 18 |
krl@pgbench=# select table_len, scanned_percent, approx_free_space, approx_free_percent from pgstattuple_approx('pgbench_accounts'); table_len │ scanned_percent │ approx_free_space │ approx_free_percent ───────────┼─────────────────┼───────────────────┼───────────────────── 268607488 │ 0 │ 131164800 │ 48.8314011558754 (1 row) krl@pgbench=# i ~/temp/bloat_investigation/table_bloat_ioguix.sql real_size │ extra_size │ extra_ratio ───────────┼────────────┼────────────────── 268607488 │ 136126464 │ 50.6785812315106 (1 row) pgbench=# select table_len, free_space, free_percent from pgstattuple('pgbench_accounts'); table_len │ free_space │ free_percent ───────────┼────────────┼────────────── 268607488 │ 131689396 │ 49.03 (1 row) |
Now we have the estimates and the truthful number. What we see is that the pgstattuple_approx(approx_free_space=131164800) and also the pure SQL estimation (extra_size=136126464) are very close to the real value of 131689396 (pgstattuple.free_space), with according deviations of ~0.5% and ~3%.
So to finish with a conclusion - estimation methods for simple tables with mostly fixed data-type columns work surprisingly well and one can really build a bloat removal check or alert on top of them.
In case you need any assistance, please feel free to contact us.
Many PostgreSQL users run their favorite database engine on Linux or some other UNIX system. While Windows is definitely an important factor in the database world, many people like the flexibility of a UNIX-style command line. One feature used by many UNIX people is “watch”. watch runs commands repeatedly, displays their output and errors and allows you to watch the program output change over time. It is therefore a perfect tool to track down errors.
In the PostgreSQL world I have seen people run watch from the command line.
watch command:|
1 |
watch -n 5 'psql -c 'SELECT now()' test' |
Every five seconds the output of the SQL function will be displayed.
While this is easy, there is a better way: You can achieve the same thing without having to leave psql at all.
|
1 2 3 4 5 6 7 8 9 10 11 12 13 14 15 16 17 18 19 20 21 22 23 24 |
[hs@zenbook ~]$ psql test psql (9.5.3) Type 'help' for help. test=# SELECT now(); now ------------------------------ 2016-06-02 19:20:42.93694+02 (1 row) test=# watch 5 Watch every 5s Thu Jun 2 19:20:48 2016 now ------------------------------- 2016-06-02 19:20:48.430408+02 (1 row) Watch every 5s Thu Jun 2 19:20:53 2016 now ------------------------------- 2016-06-02 19:20:53.435332+02 (1 row) |
The first thing to do is to run the command you want to execute repeatedly. Then just do “watch seconds”. In my example, the query will be executed every 5 seconds until watch is terminated (ctrl + c).
psql offers a nice and simple way to see what a database is doing right now.
In case you need any assistance, please feel free to contact us.
In order to receive regular updates on important changes in PostgreSQL, subscribe to our newsletter, or follow us on Facebook or LinkedIn.