To follow up on the previous introductory post here on the new pgwatch2 monitoring tool (Open Source project, GitHub link here), we’ll now look a bit deeper under the hood and provide some more info on customization options. Here we still assume the default Docker installation and I’ll first start by listing and describing all the components inside the Docker image and follow with some advanced topics.
Table of Contents
This is a standard (apt-get install postgresql) PostgreSQL database running inside Docker and its purpose is to store the information about which databases are to be monitored and in which configuration. Configurations more specifically are composed of:
Metric definitions – metrics are named SQL queries that can return pretty much everything you find useful and which can have different query text versions for different target PostgreSQL versions. Correct version of the metric definition will be chosen automatically by regularly connecting to the target database and checking the version. For defining metrics definitions you should adhere to a couple of basic concepts though:
Preset configurations - these are named pairs of metrics and their intervals, that can be applied to the databases under monitoring, enabling re-using of configs when you have a group of databases with similar monitoring requirements. Configs are stored as JSON and look like that - {“metricX”: “gathering_intervalX”, “metricY”: “gathering_intervalY”, …}.
Custom configurations – one can define metric-interval pairs also freely for every database.
Exposed port – 5342.
For easy configuration changes (adding databases to monitoring, adding metrics) there is a small Python Web application bundled, making use of the CherryPy Web-framework. For mass changes one could technically also log into the configuration database and change the tables in the “pgwatch2” schema directly. Besides the configuration options the two other useful features would be the possibility to look at the logs of the single components and at the “Stat Statements Overview” page, which will e.g. enable finding out the query with the slowest average runtime for a time period.
Exposed ports - 8080
This component is a daemon written in Go (doesn’t expose any ports) that does the heavy-lifting so to say. After setting up some variables and data exchange processes it actually implements a simple state machine which basically does the following – 1) check the configuration DB for a list of databases that should be monitored. 2) for all the found DB-s make sure they have worker processes (goroutines) for all the metrics, that execute the metric definitions after the interval passes and then sleep for duration of the interval. 3) if some DB was removed from the configuration, remove the workers.
The gatherer also has some fault tolerance built in. When the configuration DB “goes away” nothing happens – last known config will be used. When the storage backend (InfluxDB) goes away, the gathered metric values will be kept in memory and storing is re-tried periodically. At some point though the application will run out of memory and all non-persisted metrics data will be lost. Thus for more critical applications it’s still recommended to set up some kind of external monitoring for the InfluxDB (exposing port 8086).
Error log for the gatherer can be viewed via the Web UI on /logs/pgwatch2. The most common problems I can imagine being connection fails due to pg_hba.conf rules, mistypins of host address, users/passwords.
InfluxDB is a very popular Time Series Database choice (offered in two flavors – community and enterprise) and offers excellent performance and very good data compression making it a perfect fit for bundling it into Docker. Being a NoSQL database, it has though the downside of not supporting SQL but providing an own lighter query language called InfluxQL. It can master a lot things comparable to PostgreSQL, but some more complex analytics (e.g. give me top 10 slowest queries) are not really possible, so there one must fall back to visual problem detection from graphs. In the most recent version of 1.2 it has luckily though introduced support for basic subqueries, signalling that they’re aware of the problem.
InfluxDB also comes with an optional “Admin interface” for ad hoc queries, so we also enable this by default, but this UI might disappear in the future. One can expose it on port 8083 and it’s mostly useful for debugging and looking at metrics data directly in tabular format. But as said, it’s not really needed as most users should be covered by functionality provided by Grafana.
Exposed ports – 8083, 8086, 8088.
Grafana is currently the hottest dashboarding software and provides easy integration to many Time Series Databases, including InfluxDB. And putting together your own custom dashboards is indeed very easy, so please take a look at the excellent documentation and I won’t stop here for longer.
Exposed port - 3000.
By default the main user interface (Grafana) and the management UI have no authentication. To make changes to Grafana dashboards one needs to log in though. To add authentication to the Web UI launch the Docker image with the following environment parameters set:
|
1 |
docker run -d -p 3000:3000 -p 8080:8080 --name pw2 -e PW2_WEBNOANONYMOUS=1 PW2_WEBUSER=admin PW2_WEBPASSWORD=secret cybertec/pgwatch2 |
There are also some other parameters available for launching the Web UI here and from practical perspective to retrospectively change them it might be the easiest to go into the container and relaunch the app.
NB! Currently there’s no built in HTTPS support so one should use some load balancer technique to safely expose the UI over the Internet. We’ll though plan built-in support also for the next bigger version update.
By default pgwatch2 is designed to only monitor metrics that are available in a standard PostgreSQL database (meaning pg_stat_* views), without requiring any Superuser rights. This is perfect for example for developers as it enables already quite good ad hoc monitoring of live databases. But mostly you will still want more – system information like CPU or memory state for example. For such cases the workaround to “break out” from Postgres and to access system information is usually to use an “unsafe” PL-language and write a small wrapper function that returns the needed information as normal SQL results.
Shipped are currently two such “helpers” provided – a PL/Python sproc reading the CPU load and a “security definer” wrapper for pg_stat_statement information, to enable monitoring of all user queries (by default non-superusers will only see their own queries statistics), but you can easily create your own (free memory, disk space,…) and maybe we’ll add some also.
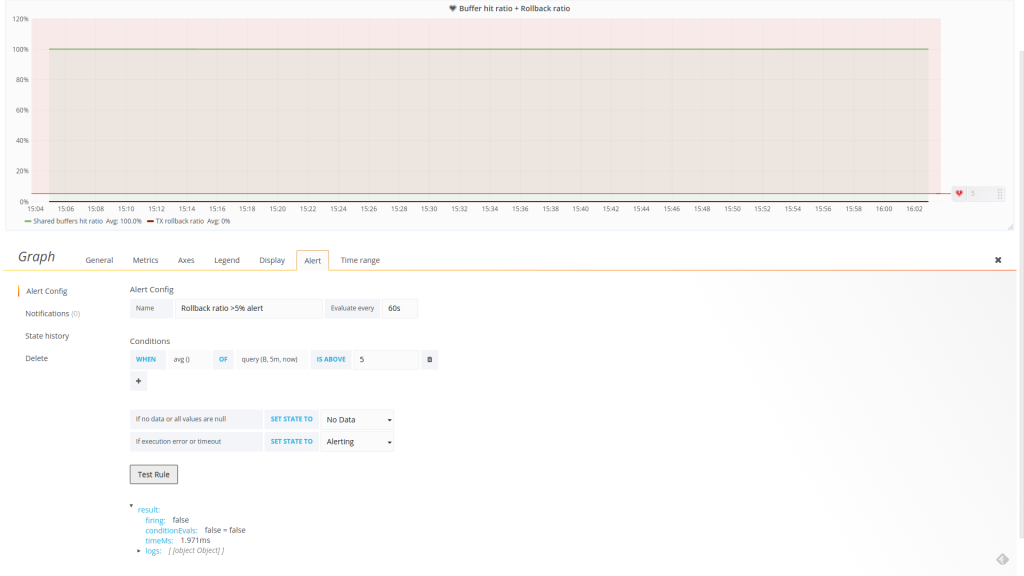
Just on time for our release, the latest major Grafana version added support for basic alerting – see here for documentation. Only graphs are currently supported though and how it works is that you can set a hard limit (constant number) on some value that you’re graphing on – stating e.g. if “DB size growth for 1h” is bigger than 1GB send me message on Slack together with an image of the graph. Other notification options provided are: email, webhook, pagerduty, victorops, opsgenie. For API based services it’s fairly easy to set up via the UI, only for email you need to go into the Grafana config file.
Another option for more advanced alerting needs would be to integrate with Kapacitor, that integrates seamlessly with InfluxDB and enables for example more intelligent detection of anomalies.
If not using a custom setup where you can switch out single components easily, migrating to a new version of Docker image (for example to enjoy benefits of a new Grafana version) needs quite some steps currently. See the take_backup.sh script here for more details.
Basically there are two options – first, go into docker and just update the component yourself – i.e. download the latest Grafana .deb package and install it with “dpkg -i ...”. This is actually the simplest way. The other way would be to fetch the latest pgwatch2 image, which already has the latest version of components, using “docker pull” and then restore the data from a backup of old setup. For restoring one needs to go into Docker again and stop InfluxDB, but that's no rocket science.
And to make the restore process easier it would make already sense to mount the host folder with the backup on the new container with “-v ~/pgwatch2_backups:/pgwatch2_backups” when starting the Docker image. Otherwise one needs to set up SSH or use something like S3 for example.
Ports 5432 and 8088 need to be exposed to take backups outside of Docker.
I’ve got quite some improvement ideas already, just take a look at the GitHub to-do-list here, but please leave a comment or open a feature request issue on GitHub if you’re still missing something that makes pgwatch2 not an option for you or your organization. Thanks!
pgwatch2 is constantly being improved and new features are added.
is it possible to run custom queries against a postgres database with pgwatch2. I can see the dashboard giving charts of the metrics from the database. But it will be helpful to know if I can also write a query and see its performance charts as well.
Hi, sorry for the late reply - but indeed, this is half of the idea that you can write your own performance or even business related queries and graph them in Grafana.
Hello,
I wanted to try pgwatch2 for monitoring a ppas95 installation.
I followed the installation recommandments.
But I receive an error in http://xxx.xxx.xxx.xxx:8080/logs/pgwatch2/200
2017/03/15 14:31:14 14:31:14.746 ERRO DBGetPGVersion: DBGetPGVersion failed pq: invalid input syntax for type double precision: "9.5.4"
2017/03/15 14:31:14 14:31:14.746 ERRO MetricsFetcher: failed to fetch pg version for IISTESTDB kpi pq: invalid input syntax for type double precision: "9.5.4"
Is it a bug or just incompatible with ppas95?
Hmm interesting, I guess there's an incompatibility with "ppas". I will try to set up a test instance and see what is different there. Thanks for reporting! Better directly on the project page though - https://github.com/cybertec-postgresql/pgwatch2 🙂
Yesterday, I played with the software and while I think I love it, I do have a few questions that don't seem to be answered in the GitHub documentation.
1. I have a database server with 10 database in it. I want to monitor all of them. I created the pgwatch2 role but not sure how to add each database in the DBs part of the web admin. When I add the pgwatch2 role, I get the all, grafana connections but not each database. I'm not sure if this is normal or I'm doing something wrong.
2. When loading the stat_activity_wrapper.sql file, do I need to do that for each database I want to monitor or is there a way to load it for all databases at a single time?