Some weeks ago the Beta 1 of upcoming Postgres 10 was released. Besides the very visible version numbering scheme change (no more X.Y.Z ) the release notes promised amongst other very cool and long-awaited features - like built-in Logical Replication and Table Partitioning - also many performance improvements, especially in the area of analytics. Release notes stated up to +40% for cases, with large number of rows (which could mean different things to different people of course), with an added note to test it out and report back. So now I found time to exactly do that and I'm again just laying out the numbers on running some analytical queries for you to evaluate.
Postgres has excellent analytical support, so making a choice on what to test exactly without going through the v10 Git changelog in details caused me halt for a moment, but I thought I'll keep it simple this time (will hopefully go deeper for the final Release Candidate) and I conjured up 3 quite simple SELECT queries based on the hints from release notes and on the schema generated by our good old friend pgbench.
|
1 2 3 4 5 6 7 8 |
/* Sum up 50mio row as SUM function was mentioned in the release notes */ SELECT sum(abalance) FROM pgbench_accounts CROSS JOIN generate_series(1, 5) /* As unique columns joining improvements where mentioned. Clone-table set up by my script */ SELECT count(*) FROM pgbench_accounts JOIN pgbench_accounts_copy using (aid) /* Grouping Sets functionality was mentioned */ SELECT count(*) FROM (SELECT aid, bid, count(*) FROM pgbench_accounts GROUP BY CUBE (aid, bid)) a; |
For pbench "scale" I chose 100, meaning 10 Million rows (1.3GB) will be populated into the pgbench_accounts table. This gives enough rows but still fits into memory so that runtimes are more predictable.
I spun up a modest c3.xlarge (4 cores, Intel Xeon E5-2680 v2 @ 2.8GHz, 7.5GB RAM, RHEL 7.3) instance on AWS, but as we're not testing hardware it should be fine. The disk doesn't really matter here, as it's a read-only test and everything will fit into RAM. For additional testing fairness, my test script also performed queries in turns between 9.6 and 10 Beta to try to suppress the effects of possible background load jitter of a shared virtual machine.
For running Postgres, I used official Postgres packages from the YUM repo for both 9.6.3 and 10 Beta1, just changing the port to 5433 for 10 Beta.
Concerning server settings I left everything to defaults, except below changes on both clusters for reasons added as comments.
|
1 2 3 4 5 |
shared_buffers='2GB' # to ensure buffers our dataset work_mem='128MB' # increase work_mem as it helps a lot for analytical stuff max_parallel_workers_per_gather=0 # test single core i.e. algorithm performance shared_preload_libraries='pg_stat_statements' # for storing/analyzing test results logging_collector=on |
After running my test script (1h of analytical queries for both clusters), which basically does all the work out of the box and can be found here, I got the below numbers. For generating the percentage differences btw, you could use this query here.
| Query | Instance | Mean time (s) | % Change | Stddev time (s) | % Change |
| SUM | 9.6 | 9.74 | 3.86 | ||
| SUM | 10beta1 | 9.28 | -5.0 | 2.05 | -87.9 |
| JOIN | 9.6 | 5.05 | 2.13 | ||
| JOIN | 10beta1 | 5.98 | +15.5 | 1.53 | -39.0 |
| CUBE | 9.6 | 10.35 | 1.53 | ||
| CUBE | 10beta1 | 8.75 | -18.3 | 1.93 | 21.0 |
So what do these numbers tell us? 2 queries out of 3 have improved – that's good of course. Any significant changes? Not so many. Only for the grouping sets query. But the advertised unique join feature improvement definitely did not show out, the opposite sadly. For consolation - at least it's more predictably slow – standard deviation fell by 40% 🙂
But to sum it up – the general impression is still positive as aggregate runtimes over all queries still improved by 5%. One could think that 5% is not much – but the fact is that Postgres has matured over decades and is already using very good algorithms and big improvements can come only from venturing into the "parallel worlds".
NB! Not to forget - it's a BETA release and these numbers don't mean too much in the long run.
After I was done with the analytical queries, I also got hungry for more and thought I'll check out how do normal read queries perform? So I also ran a quick "pgbench –select-only" (single index scans) tests for different client/scale settings... and actually noticed that on average the 10 Beta was consistently a couple of percent slower there when measured in TPS! Not a big difference of course, given that we're still dealing with beta software here... but it still made me a bit sceptical still. So if anyone has time, please test it out yourself (for example using my script here) and see if this was some setup glitch from my side or something else. Or just comment what you think of this test. If you have any questions, you can also contact us directly.
We have written about our hatchling Open Source PostgreSQL monitoring tool called pgwatch2 some months ago here and here but now I think it deserves another nudge, as a lot of new features have found their way into the code.
For our new readers - pgwatch2 is a simple but flexible Postgres monitoring tool, aiming to provide a nice balance between features / usability / out-of-the-box experience, concentrating on nice graphs using Grafana. Getting started with pgwatch2 by the way couldn't be any easier and takes just minutes thanks to Docker - please check the links from above for more details.
So, find a listing of those new features below. Please feel free to check out the new version and let us know on GitHub if you're still missing something in the tool or are having difficulties with something! Thanks a lot!
Project GitHub link - here
Previously, only InfluxDB was supported as metrics storing datastore - now when running the pgwatch2 daemon it is possible to specify that metrics should be stored also in Graphite. Use --datastore / --graphite-host / --graphite-port parameters for that. Metrics will be stored in the "pgwatch2" namespace then. Sadly there are no out of the box dashboards for Graphite though, so you need to compose them manually, based on Influx ones...
Previously one could really recommend out-of-the-box image only for local / LAN / datacenter usage, but now with SSL support one can expose both the Web UI (configure the gathered metrics and hosts) and Grafana (graphs on gathere metrics) also over the Internet, given you'll set some strong passwords of course. New self-signed (aka snake oil) SSL cert will generated on every container startup when the below flags are set, so it should be relatively OK.
|
1 |
docker run ... -e PW2_WEBSSL=1 -e PW2_GRAFANASSL=1 --name pw2 cybertec/pgwatch2 |
New SQL text versions for some metrics. Has mostly to do with "*xlog*" functions renamed to "*wal*".
This had actually to do only with reading/transforming the Postgres server version number universally.
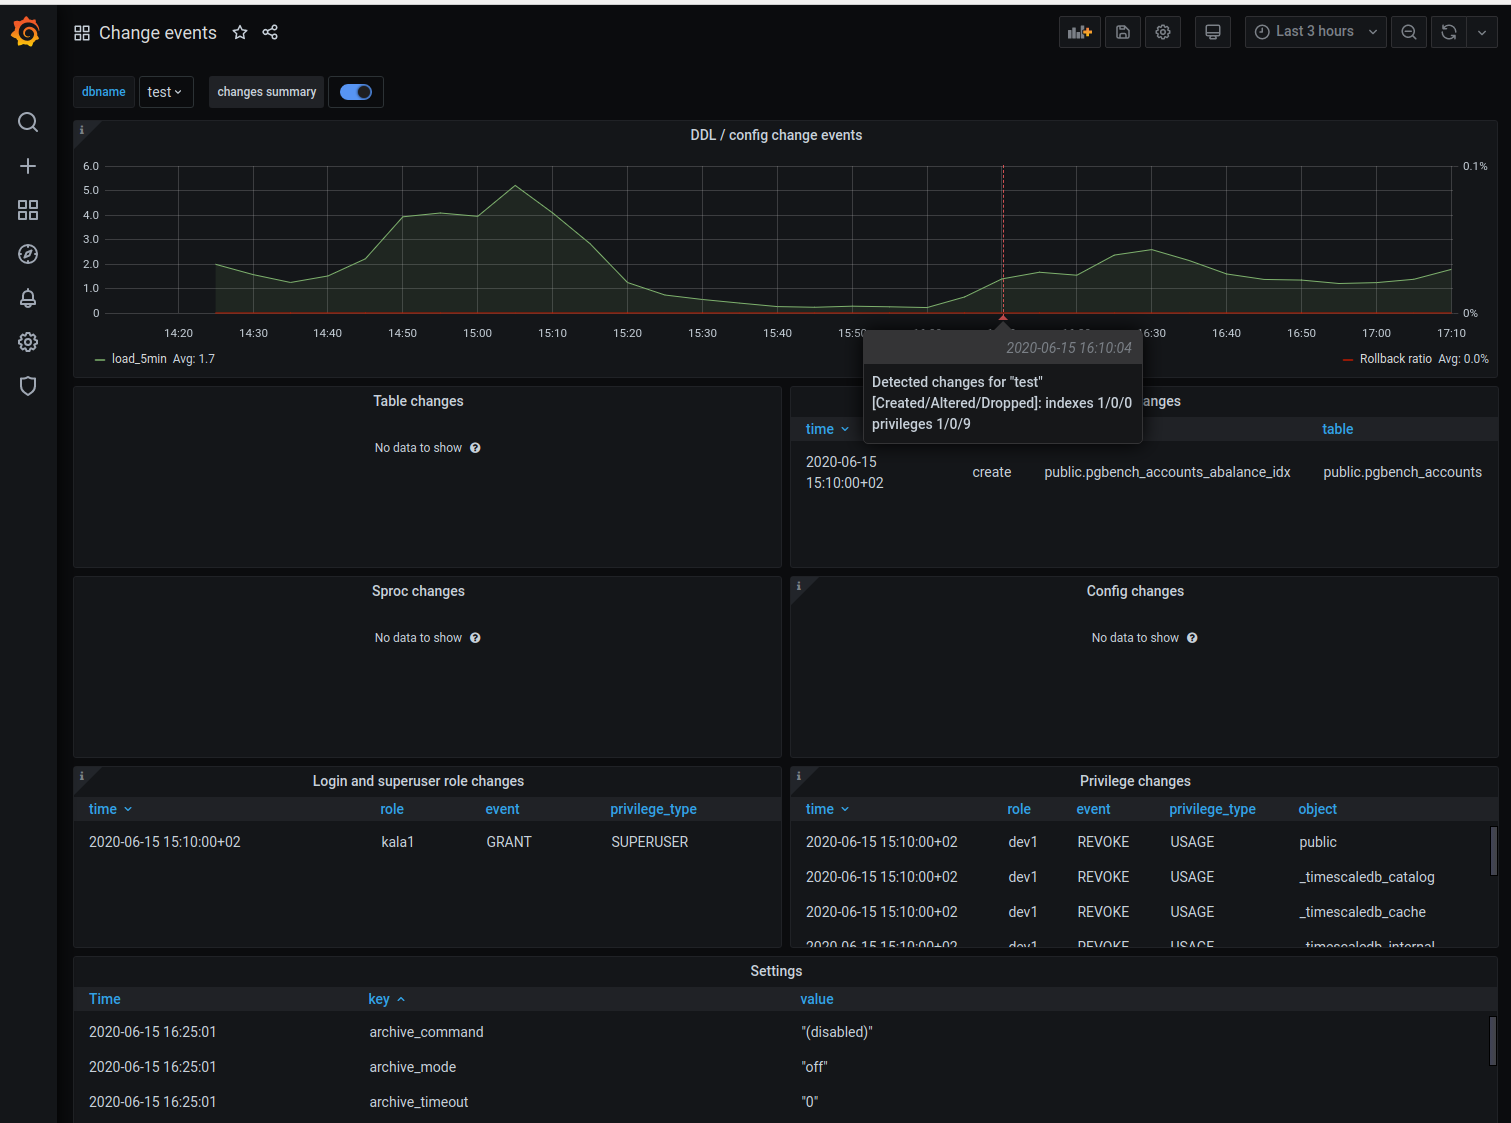
When the new "change_events" metric is enabled, the pgwatch2 daemon will track the signature of tables/views/indexes, stored procedure code and values of server configuration parameters and will log an "change event" when any changes detected. These events graphed together with the "CPU load" and "Rollback ratio" graphs should help to quickly pinpoint problems arising from new schema rollouts or config changes by the DBAs.
The daemon is now complied inside the Docker. This increases of course the image size but makes experimenting and small behaviour adjustments easier.
Histograms and heatmaps now possible! See demo here.
More info on backup/restore and metrics setup.
pgwatch2 is constantly being improved and new features are added. Learn more.