by Kaarel Moppel
Pretty often I’m asked: Does our PostgreSQL monitoring tool pgwatch2 work with managed cloud database service providers like Google Cloud? Well, the short answer would be, “Yes, we scan!”. But as always the devil is in the details. You should be aware of a couple of nuances/extra steps.
In order to shed some light on the topic and to document the process a bit, I’ve put together a small “how-to”. Here's how to use pgwatch2 with Google Cloud’s PostgreSQL offering, as an example of a managed database service.
A small disclaimer though - I haven’t personally tried out all the newest/more niche cloud providers. So I wouldn’t give a 100% guarantee on that promise, but rather a 99.9% one 🙂
And if the name pgwatch2 doesn’t sound too familiar, it’s one of the most popular Open Source Postgres-specific monitoring tools out there! It supports many flexible deployment options, metric fetching features, and data stores. More info about the project can be found in the official documentation. If you prefer looking at the code, then jump right to Github.
But before we go hands-on: What does a managed database service, like Google Cloud SQL's offering, actually consist of? Why wouldn't it work?
For those who don't work with the ins and outs of database systems daily, it might not be so apparent. In most cases, the thing that you get after clicking “$mydb > Next > Next > Launch” or its equivalent is actually very close to a vanilla PostgreSQL instance! In other words, you're getting almost the same thing that you would get when typing apt install postgresql on your server or workstation, at least in standard SQL matters of schema and data management, i.e. for DDL and DML.
The biggest difference (apart from the good things like automatically taking care of high availability, backups, and updates) is actually the fact that you’re being stripped of security-sensitive features, like not being handed a real superuser account with the ability to execute arbitrary commands on the operating system level! Which is a scary thing I must agree 🙂 Read more about that here if you’re not quite sure what I mean. But there are also other aspects, like the removal of advanced configuration features. So basically the limitations could be summarized within a few groups:
Obviously, it's well justified to disable arbitrary command execution with COPY PROGRAM or archive_command — but this also includes no file system access via pg_ls_dir(), etc. That would hint at implementation details or provide extra information for possible attack vectors to break out of the so called “sandbox”.
Here the reasoning mostly is that you should not shoot yourself in the foot and act in accordance with the booked hardware resources. But there are also some more sneaky considerations like for example nudging you towards vendor lock-in, by disabling PostgreSQL’s built-in Logical Replication that basically can enable relatively painless, near-zero downtime, migrating to another service provider or to a self-managed full-featured Postgres instance. Feel free to read more about it here, if the concept seems new to you.
This covers limiting/controlling both the pg_hba.conf infrastructure so that for example SSL is always required or access is guaranteed to be possible only from within that cloud account, and also aspects like limiting the “pseudo-superuser” so that, by default, it does not even see other people’s running queries.
All cloud providers, including Google Cloud, only allow a short whitelist of pre-approved extensions to be activated, mostly those extensions from the official “contrib” package, since it’s a lot of work to both review the code and guarantee that it’s stable and secure. This is of course understandable, but at the same time, also the most annoying thing about the managed services for me personally as there are dozens and dozens of great PostgreSQL extensions out there and this extensibility infrastructure is the key factor to PostgreSQL’s constantly rising popularity.
But then again it’s not all bad — there are the other aspects that, especially for more casual or novice database users, make them a good choice: hiding complexity like HA/failover; backups; server configuration; and providing some basic metrics.
Since all managed service providers also provide some kind of performance metrics and dashboards out of the box, which in the case of Google’s offering actually looks pretty decent (it runs under the name of “Query insights”), the big question is - why should one use an extra tool at all?
Well, I can think of some good reasons:
There’s probably some truth to the old idiom - “You can't teach an old dog new tricks”. People usually don’t want to constantly work with new tools that are only marginally better than old ones. The usefulness is in the end somewhat limited by what the Postgres engine can offer on the instrumentation side.
What if your company uses many different cloud database service providers in addition to running some self-managed ones? Do you really want to maintain the mental overhead of knowing all the details of the different providers and translating between different vocabularies? Cloud providers obviously have not managed to agree on a common glossary. I haven't yet mentioned constantly logging into different environments, or searching for the correct browser tab. Having a single tool with all the metrics from different systems is obviously a better choice.
What if your development team is highly segregated for security reasons? And doesn’t have common access to the graphs/API that the service provider offers? What if you have some freelance consultants on your team and you only want to expose a relevant subset of the metrics to them? In such cases, it might be better to collect, manage and expose metrics according to your own rules.
Since managed services have a huge user base, they must generally be implemented in a pretty simplistic way. People that are not database experts need to be able to jump right in and get going in minutes. This again might not be optimal for database professionals who want to see more detailed information.
What if your cloud provider restricts your ability to adjust the frequency of background metrics collection? What if you prefer to visualize your data in a specific format, such as tables instead of graphs? Additionally, what if you want to gather all the metrics that PostgreSQL provides? You'll find you have much more flexibility with 3rd party tools.
One area where the cloud service providers for some reason have not yet done their best is in making it easy to set up basic alerts. Providing a flexible as well as an easy-to-use interface, similar to what Grafana offers, would definitely be a boon for “cloud migrants”.
All this positive stuff being said, nothing is perfect, sadly 🙂 External tools also have one huge downside when it comes to monitoring managed databases – we don’t have convenient access to the OS-level metrics! Luckily, this data is mostly available somewhere in the stomach of the behemoth. It can be extracted via some kind of API, but you generally need to write custom code for that. As an alternative, with some tools like Grafana (which supports mixed datasource graphs), it can be also integrated to be fetched on the fly. There may be some extra lag. But then again, retention policies could still become a problem, if you’d like to occasionally look at data that is many months old.
In short – having options is a good thing and I would generally not want to just rely on my cloud provider knowing what is best for me. At least for more important databases.
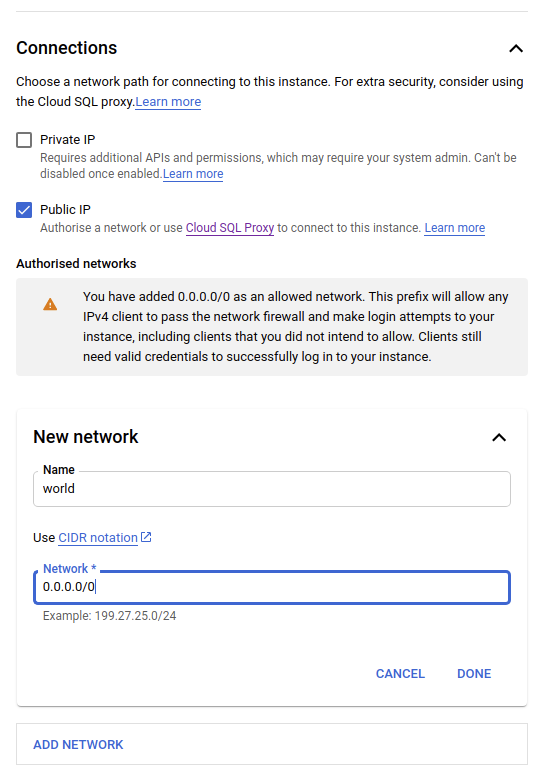
Initially, I thought about skipping this section... as the GUI is actually quite simple and neat, and things should be self-explanatory. However, there were a couple of configuration sections where I had to pause for a bit and think, so I’ll post screenshots about those.
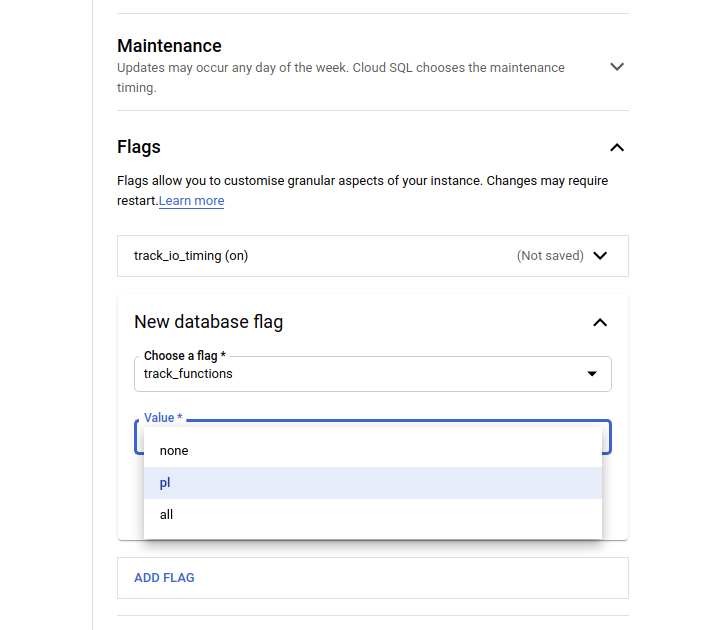
The thing is that all the biggest cloud providers provide a multitude of managed database engines. In an attempt to unify the vocabulary, they might have opted for some wording that in PostgreSQL's case is not obvious. For example “Flags” mean PostgreSQL server configuration parameters!
Note that I’m not covering the prerequisite part about setting up an account and hooking up a credit card, etc.
Due to the fact that we are only interested in monitoring here, we’ll also need to add an extra step. We need to create a monitoring role to be used by the pgwatch2 metrics collector. It’s never recommended to monitor with the default admin/superuser account over a remote connection! Luckily, starting from v10, the Postgres project caters for that common monitoring need. There’s a special system grant called pg_monitor for that purpose. pg_monitor elevates the privileges just a bit. The steps below are listed in the documentation and also on Github's mini-how-to.
|
1 2 3 4 |
CREATE USER pgwatch2 WITH PASSWORD 'secret'; GRANT pg_monitor TO pgwatch2; -- pg_monitor is a special system role for metrics access |
I'm skipping the actual installation of pgwatch2 here. Please follow the documentation for that. Basically, once we have the metrics agent and the metrics storage DB in place (Postgres with TimescaleDB recommended!) we just need a simple YAML config file.
As I already mentioned in the introductory section, no problems are expected and it should just work! Given that you’re using the correct configuration, of course 🙂 And here, since managed cloud services are becoming increasingly popular, we’ve now made it pretty easy on the pgwatch2 side. pgwatch2 has some preset configurations tuned for various engines! In the case of Google Cloud, an example YAML configuration entry (assuming a file-based installation) should use an according preset config named “gce”.
|
1 2 3 4 5 6 7 8 9 10 11 12 |
- unique_name: gce_mon dbtype: postgres # use postgres-continuous-discovery here if want to monitor all Dbs, # optionally according to a regex pattern host: 1.2.3.4 # paste your real IP/hostname here port: 5432 dbname: postgres # monitoring a single DB only here user: pgwatch2 password: # actual password is in the .pgpass file stmt_timeout: 5 # seconds preset_metrics: gce is_enabled: true sslmode: require |
After that's in place, we can test start the pgwatch2 metrics collector and see if it looks good:
|
1 2 3 4 5 6 7 8 |
$ pgwatch-daemon -c /etc/pgwatch2/config/instances.yaml --datastore=postgres –pg-metric-store- conn-str=”postgresql://pgwatch2@localhost:5432/pgwatch2_metrics” 2021/05/06 14:10:05 WARN main: --metrics-folder path not specified, using /etc/pgwatch2/metrics 2021/05/06 14:10:06 ERRO MetricGathererLoop: Failed to fetch metric data for [gce_mon:stat_statements_calls]: pq: relation 'pg_stat_statements' does not exist 2021/05/06 14:10:06 ERRO MetricGathererLoop: Failed to fetch metric data for [gce_mon:stat_statements]: pq: function get_stat_statements() does not exist |
Hmm, some errors. Well, it doesn’t look good for a “preset config”, you might think. But in this case, it's actually expected for a totally fresh and pristine instance. Since Postgres is not actually 100% pre-configured for exhaustive out-of-the-box monitoring, a couple of small moves are required. These are covered by the next chapter.
???? If you’d like to see more details on these errors, or in general see what pgwatch2 is actually doing, then set the --verbosity parameter to info level. There’s also a debug level, but that’s meant rather for bug tracking/developing. It will overflow you with information.
Basically, we need to do 2 things. The first one is a “must have” for all Postgres databases that could get into performance issues at some point, or where we need some visibility of what users are actually executing more often. The 2nd one is actually more of a “nice to have”. However, I always enable it on at least semi-modern hardware. Without it, you’re fine. It's just that some preset Grafana dashboards provided by the pgwatch2 project will look a bit more empty, no biggie.
For most managed services, the extension itself is already activated and present in shared_preload_libraries - if not, you most definitely are allowed to activate it, as it’s the single most useful extension for performance troubleshooting and comes bundled with Postgres by default. Note that you need to execute the code listed below for all databases that you plan to monitor!
|
1 |
CREATE EXTENSION pg_stat_statements; |
Basically, we need to enable the track_io_timing parameter and set track_functions to at least pl. Note that the all setting is normally not needed unless you plan to optimize some C functions coming in from extensions. For the Google service, this would look something like what you see below. Remember, server configuration parameters/settings are called “flags” on Google Cloud!
Given that our metrics collection daemon has been running for a while, we can finally fire up Grafana to look at some nice graphs! The usability and features of Grafana together with a bunch of ready-made dashboards to cover all common monitoring needs are one of the main reasons why users like pgwatch2. It makes diving into the metrics quite effortless. Changing the visual side just takes a couple of clicks. That's something that's not possible with the tools provided by the cloud vendors!
Note that when starting from scratch, you need to import the pgwatch2 dashboards into Grafana. This can be done manually “per dashboard”, or also with an “import all” script, exemplified in the documentation here.
Basically, the majority of dashboards should work as when monitoring a local setup. Some dashboards like the “Systems Stats” will be unusable and empty because we cannot create PL/Python helpers on the managed server to extract CPU load, etc.
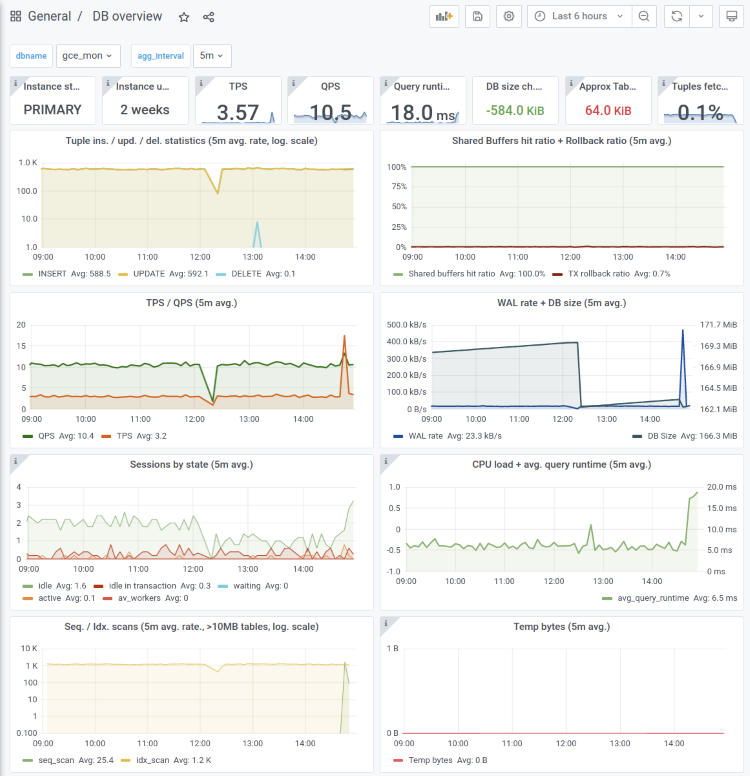
Also, instead of the standard “DB overview” dashboard that most often serves as a starting point when reports of weird database behavior come in, you might prefer using the “DB overview unprivileged” dashboard. It's compiled exactly for such cases where the metrics agent might not have full access. In this case, we only show metrics that are always there, even for plain users with only a CONNECT privilege. It looks like the following:
To wrap it all up! As we saw, pgwatch2 can be configured to work Google Cloud SQL with only a few modifications. It should actually be similarly easy with all other flavors of PostgreSQL. And compared to service provider instrumentation, it shines! Especially in that, it provides many more dashboards (around 30) to cover all possible problem areas. It also allows you to easily define new custom metrics via SQL. That means they can also come from the business domain. So you can have some nice sales counters right together with your critical database metrics.
The peculiarities of using popular managed cloud services with pgwatch2 are also documented in a separate section. Check that out here for additional hints and tips if you're planning to give pgwatch2 a go for your cloud instance.
Our team is proud to introduce a new pg_timetable v4.4 release!
This time we focused on implementing a couple of new features, as well as improving performance.
I want to remind you that pg_timetable is a community project. So, please, don’t hesitate to ask any questions, to report bugs, to star the pg_timetable project, and to tell the world about it.
The first new cool feature we've added to pg_timetable v4.4 release is the web-server providing REST API. Right now it only serves two endpoints: /liveness and /readiness.
GET /liveness always returns HTTP status code 200, which only indicates that pg_timetable is running, e.g.
|
1 2 3 4 |
$ curl -i localhost:8080/liveness HTTP/1.1 200 OK Date: Wed, 09 Feb 2022 15:11:02 GMT Content-Length: 0 |
GET /readiness returns HTTP status code 200 when pg_timetable is running and the scheduler is in the main loop processing chains, e.g.
|
1 2 3 4 |
$ curl -i localhost:8080/readiness HTTP/1.1 200 OK Date: Wed, 09 Feb 2022 15:30:25 GMT Content-Length: 0 |
If the scheduler connects to the database, creates a database schema, or upgrades it, it will return HTTP status code 503, i.e.
|
1 2 3 4 |
$ curl -i localhost:8080/readiness HTTP/1.1 503 Service Unavailable Date: Wed, 09 Feb 2022 15:10:48 GMT Content-Length: 0 |
This is useful for monitoring purposes; for example, to perform HTTP health checks. We are planning to add more endpoints to perform start/stop/reinitialize/restarts/reloads and to provide extended monitoring statistics.
The REST API server is disabled by default. You should use the --rest-port command-line parameter to activate it:
|
1 2 3 4 5 6 7 |
$ ./pg_timetable --rest-port=8080 --clientname=loader2 postgresql://scheduler@localhost/timetable 2022-02-09 16:36:08.593 [INFO] [port:8080] Starting REST API server... 2022-02-09 16:36:08.867 [INFO] Database connection established 2022-02-09 16:36:08.875 [INFO] Accepting asynchronous chains execution requests... 2022-02-09 16:36:08.880 [INFO] [count:0] Retrieve scheduled chains to run @reboot 2022-02-09 16:36:08.884 [INFO] [count:2] Retrieve interval chains to run ... |
For debugging and monitoring purposes, we've added detailed version output in pg_timetable v4.4. You should use the -v, --version command-line argument to force pg_timetable to output the associated version information:
|
1 2 3 4 5 6 |
$ pg_timetable.exe -v pg_timetable: Version: 4.4.0 DB Schema: 00381 Git Commit: 52e12177d0025b9b01c737cea06048fc350315f5 Built: 2022-02-07T14:06:57Z |
The first line is the version of the binary itself, or the name of the branch if this is a development build. For example, the latest tag of our cybertecpostgresql/pg_timetable Docker image is always built against the master branch, thus the output will be slightly different:
|
1 2 3 4 5 6 |
$ docker run --rm cybertecpostgresql/pg_timetable:latest -v pg_timetable: Version: master DB Schema: 00381 Git Commit: e67c6872ab9aa91a262aab5b75fb76ea51e050b8 Built: 2022-02-07T16:01:25+01:00 |
⚠️ Since the latest tag is up to date with the master branch, you probably want to use the latest stable tag in production.
The database schema line in the output indicates the version of the latest database migration applied. We use the ID of the Github issue that caused these changes as an identifier. That helps quickly locate the history connected with the schema change, e.g. Issue #381.
Git commit is the commit against which the binary is built, and the precise time is placed on the last line.
It turns out that on highly loaded systems, the scheduler inserts too many rows in the system table run_status: one row for chain start and one for a finish. Over time, the target table may contain a high number of rows, causing internal functions to lag for about ~2-3 seconds for each call. That also means resource usage can get to be too much.
The whole idea behind run_status was to track active chains so the scheduler won't run new chains if the active number exceeds max_instances.
In fact, we don't need such a detailed table, because we already have log and execution_log tables where every piece of the chain of execution is already stored.
Also, this run_status table was designed in a very complicated way, but that allowed it to hold many details. On the other hand, managing active/running chains can be done in a similar way to how we manage active sessions. From the logical point of view, this is the same. So now in the new version, instead of managing this complicated run_status table, we switched to another active_chain table. And the idea behind this active_chain table is the same as the active_session table that we already use for sessions.
The idea itself can be described in 3 steps:
1. make it UNLOGGED to save space and not produce WALs
2. add a row to the active_chain table when a chain starts
3. delete a row from the active_chain table when a chain is finished or failed.
In this way, we can handle a load of several thousand parallel jobs simultaneously without visible degradation -- well, at least in the test environment.
There are some more improvements. The full changelog is available on the v4.4 release page. We want to thank all contributors and users for their help.
If you want to contribute to pg_timetable and help to make it better:
In conclusion, I wish you all the best! ♥️
Please, stay safe – so we can meet in person at one of the conferences, meetups, or training sessions!
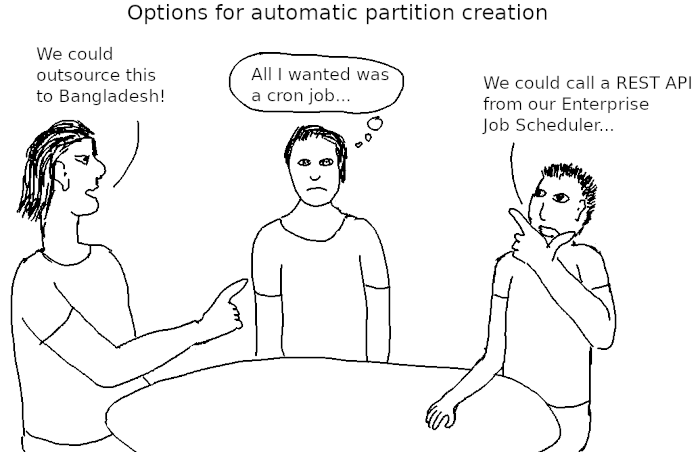
Table partitioning is one of the best-liked features out of the more recent PostgreSQL developments. However, there is no support for automatic partition creation yet. This article shows what you can do to remedy that.
There are essentially two use cases:
I will call the first option time-triggered partitioning and the latter on-demand partitioning.
The lack of PostgreSQL support in this area is an inconvenience at worst. There are several ways to work around the limitation:
You can use the operating system scheduler (cron on Unix-like systems or “Task Scheduler” on Windows). The job would connect to the database using psql and run the appropriate CREATE TABLE and ALTER TABLE ... ATTACH PARTITION statements.
Typically, you would want to schedule such a job directly on the database server machine. Sometimes you cannot do that, for example, because you are using a hosted database and have no access to the operating system. In that case, you can schedule the job on a different machine.
PostgreSQL doesn't have a built-in job scheduling system. However, there are extensions like pg_timetable or pg_cron that allow you to schedule database jobs. Installing a third-party extension adds another dependency to your software architecture, and it may not be possible on a hosted database. On the other hand, it will make your job independent from the operating system scheduler and is less likely to be forgotten when you move the database.
pg_partman is a PostgreSQL extension that specializes in partition management. It was useful and necessary in the bad old days before v10 introduced “declarative partitioning”: it created triggers and constraints for you. Today, most of this functionality is unnecessary, but the support for automatic partition creation can still come in handy.
This is more difficult, and here the lack of support from PostgreSQL core is more painful.
The naïve approach to try is to have a BEFORE INSERT trigger that creates and attaches a new partition. However, that will cause one of the following “object in use” errors:
|
1 2 |
ERROR: cannot CREATE TABLE .. PARTITION OF 'tab' because it is being used by active queries in this session |
or
|
1 2 |
ERROR: cannot ALTER TABLE 'tab' because it is being used by active queries in this session |
Essentially, by the time the INSERT has started, you cannot modify the table definition any more.
LISTEN and NOTIFY as a workaroundWhat we need is asynchronous processing: you have to create the new partition in a different transaction. Since we certainly cannot create the partition before we INSERT, it has to be afterwards. However, the partition has to exist at the time of the INSERT, so we would seem to be at an impasse.
But there is another option: instead of creating the partition in a single step, we can first create a table and then attach it later, as a partition of the partitioned table. The sequence of events could then be like this:
BEFORE INSERT trigger, create a new table that is not yet a partition (skipped if the table already exists)The remaining question is how to perform the attachment “at some later time”. There is a convenient feature in PostgreSQL for asynchronous processing: LISTEN and NOTIFY. A session can register for notifications on a channel (often a table name) with LISTEN and will then be notified asynchronously whenever another backend calls NOTIFY for that channel. The sending backend can add a message string to the notification.
BEFORE INSERT trigger as follows:NOTIFY with the new partition key as the argumentINSERT, since we already inserted the row in the partition
Note that this requires that we have a default partition, otherwise inserting a row that does not match an existing partition will fail.
In a different session, a daemon process waits for notifications and attaches the new table to the partitioned table.
Here is the definition of the partitioned table:
|
1 2 3 4 5 6 7 |
CREATE TABLE tab ( id bigint GENERATED ALWAYS AS IDENTITY, ts timestamp NOT NULL, data text ) PARTITION BY LIST ((ts::date)); CREATE TABLE tab_def PARTITION OF tab DEFAULT; |
I chose list partitioning to simplify the listener code, although that is not required.
The trigger looks like this:
|
1 2 3 4 5 6 7 8 9 10 11 12 13 14 15 16 17 18 19 20 21 22 23 24 25 26 27 28 29 30 31 32 33 34 35 36 37 38 39 40 41 |
CREATE FUNCTION part_trig() RETURNS trigger LANGUAGE plpgsql AS $$BEGIN BEGIN /* try to create a table for the new partition */ EXECUTE format( 'CREATE TABLE %I (LIKE tab INCLUDING INDEXES)', 'tab_' || to_char(NEW.ts, 'YYYY-MM-DD') ); /* * tell listener to attach the partition * (only if a new table was created) */ EXECUTE format( 'NOTIFY tab, %L', to_char(NEW.ts, 'YYYY-MM-DD') ); EXCEPTION WHEN duplicate_table THEN NULL; -- ignore END; /* insert into the new partition */ EXECUTE format( 'INSERT INTO %I VALUES ($1.*)', 'tab_' || to_char(NEW.ts, 'YYYY-MM-DD') ) USING NEW; /* skip insert into the partitioned table */ RETURN NULL; END;$$; CREATE TRIGGER part_trig BEFORE INSERT ON TAB FOR EACH ROW WHEN (pg_trigger_depth() < 1) EXECUTE FUNCTION part_trig(); |
To understand why the trigger function returns NULL, read my blog post on the topic. The WHEN clause in the trigger definition avoids infinite recursion: without it, inserting a row into a partition would call the trigger function again.
For the listener, we need to use a PostgreSQL client API that supports asynchronous notification. I chose to use C:
|
1 2 3 4 5 6 7 8 9 10 11 12 13 14 15 16 17 18 19 20 21 22 23 24 25 26 27 28 29 30 31 32 33 34 35 36 37 38 39 40 41 42 43 44 45 46 47 48 49 50 51 52 53 54 55 56 57 58 59 60 61 62 63 64 65 66 67 68 69 70 71 72 73 74 75 76 77 78 79 80 81 82 83 84 85 86 87 88 89 90 91 92 93 94 95 96 97 98 99 100 101 102 103 104 105 106 107 108 109 110 111 112 113 114 115 116 117 118 119 120 121 122 123 124 125 126 127 128 129 130 131 132 133 134 135 136 137 138 139 140 141 142 |
#include <libpq-fe.h> #include <stdio.h> #include <stdlib.h> #include <string.h> #include <sys/select.h> #include <errno.h> static int attach_partition(PGconn *conn, char *table, char *datestr) { PGresult *res; char *esc_tab, *esc_part, *esc_date; /* identifiers are at most 63 bytes long */ char stmt[400], part[64]; /* escape table and partition name */ esc_tab = PQescapeIdentifier(conn, table, 63); snprintf(part, 63, '%s_%s', table, datestr); esc_part = PQescapeIdentifier(conn, part, 63); esc_date = PQescapeLiteral(conn, datestr, 10); /* construct statement */ sprintf(stmt, 'ALTER TABLE %s ATTACH PARTITION %s FOR VALUES IN (%s)', esc_tab, esc_part, esc_date); free(esc_tab); free(esc_part); free(esc_date); /* execute statement */ if ((res = PQexec(conn, stmt)) == NULL) { fprintf(stderr, 'Out of memory sending statementn'); return 0; } if (PQresultStatus(res) != PGRES_COMMAND_OK) { fprintf(stderr, 'Error attaching partition: %sn', PQresultErrorMessage(res)); return 0; } PQclear(res); return 1; } int main (int argc, char **argv) { PGconn *conn; int sock; PGresult *res; /* connect to PostgreSQL with default parameters */ if ((conn = PQconnectdb('application_name=listener')) == NULL) { fprintf(stderr, 'Out of memory connecting to PostgreSQLn'); return 1; } if (PQstatus(conn) != CONNECTION_OK) { fprintf(stderr, 'Error connecting to PostgreSQL: %sn', PQerrorMessage(conn)); PQfinish(conn); return 1; } /* get network socket for the connection */ if ((sock = PQsocket(conn)) < 0) { fprintf(stderr, 'Error getting connection network socketn'); PQfinish(conn); return 1; } /* listen on a channel */ if ((res = PQexec(conn, 'LISTEN tab')) == NULL) { fprintf(stderr, 'Out of memory sending LISTENn'); PQfinish(conn); return 1; } if (PQresultStatus(res) != PGRES_COMMAND_OK) { fprintf(stderr, 'Error listening on channel: %sn', PQresultErrorMessage(res)); PQfinish(conn); return 1; } PQclear(res); while(1) { fd_set sockets; struct pgNotify *note; /* block waiting for activity on the network socket */ FD_ZERO(&sockets); FD_SET(sock, &sockets); errno = 0; if (select(sock + 1, &sockets, NULL, NULL, NULL) < 0) { perror('Error waiting for notification'); PQfinish(conn); return 1; } /* consume the input */ if (PQconsumeInput(conn) == 0) { fprintf(stderr, 'Error receiving data: %sn', PQerrorMessage(conn)); PQfinish(conn); return 1; } /* check for notifications */ note = PQnotifies(conn); if (note != NULL) { if (!attach_partition(conn, note->relname, note->extra)) { PQfinish(conn); return 1; } PQfreemem(note); } } } |
The sample code above should be free from race conditions. However, performance will not be good. Let's compare the speed of 100000 inserts with and without the trigger:
|
1 2 3 4 5 6 7 8 9 10 11 12 13 14 15 16 17 18 19 20 21 |
test=# TRUNCATE tab; TRUNCATE TABLE test=# timing Timing is on. test=# INSERT INTO tab (ts, data) SELECT clock_timestamp(), 'something' FROM generate_series(1, 100000); INSERT 0 0 Time: 3354.275 ms (00:03.354) test=# ALTER TABLE tab DISABLE TRIGGER part_trig; ALTER TABLE test=# TRUNCATE tab; TRUNCATE TABLE Time: 20.005 ms test=# INSERT INTO tab (ts, data) SELECT clock_timestamp(), 'something' FROM generate_series(1, 100000); INSERT 0 100000 Time: 120.869 ms |
So while the code works, the trigger incurs an overhead of about 32 milliseconds per row, which is quite a lot. The whole operation takes 28 times as long as without the trigger, but that factor is only so high because there are no indexes on the table. It would be possible to reduce the overhead by writing the trigger function in C as well, but that would add still more complexity.
While it is fairly easy to work around the lack of time-triggered partition creation, it is more difficult to create partitions on demand when rows are inserted. We found a solution using triggers, LISTEN and NOTIFY, but the solution was complicated and the performance impact was severe. It would be good to get better support from PostgreSQL core for this!
If you are interested in partitioning, you may want to read our articles about partition management and partitioning live data on foot and with pg_rewrite.
In order to receive regular updates on important changes in PostgreSQL, subscribe to our newsletter, or follow us on Twitter, Facebook, or LinkedIn.