When people are talking about database performance monitoring, they usually think of inspecting one PostgreSQL database server at a time. While this is certainly useful, it can also be quite beneficial to inspect the status of an entire database cluster or to inspect a set of servers working together at once. Fortunately, there are easy means to achieve that with PostgreSQL. How this works can be outlined in this post.
Table of Contents
If you want to take a deep look at PostgreSQL performance, there is really no way around pg_stat_statements. It offers a lot of information and is really easy to use.
To install pg_stat_statements, the following steps are necessary:
Once this is done, PostgreSQL will already be busy collecting data on your database hosts. However, how can we create a “clusterwide pg_stat_statements” view so that we can inspect an entire set of servers at once?
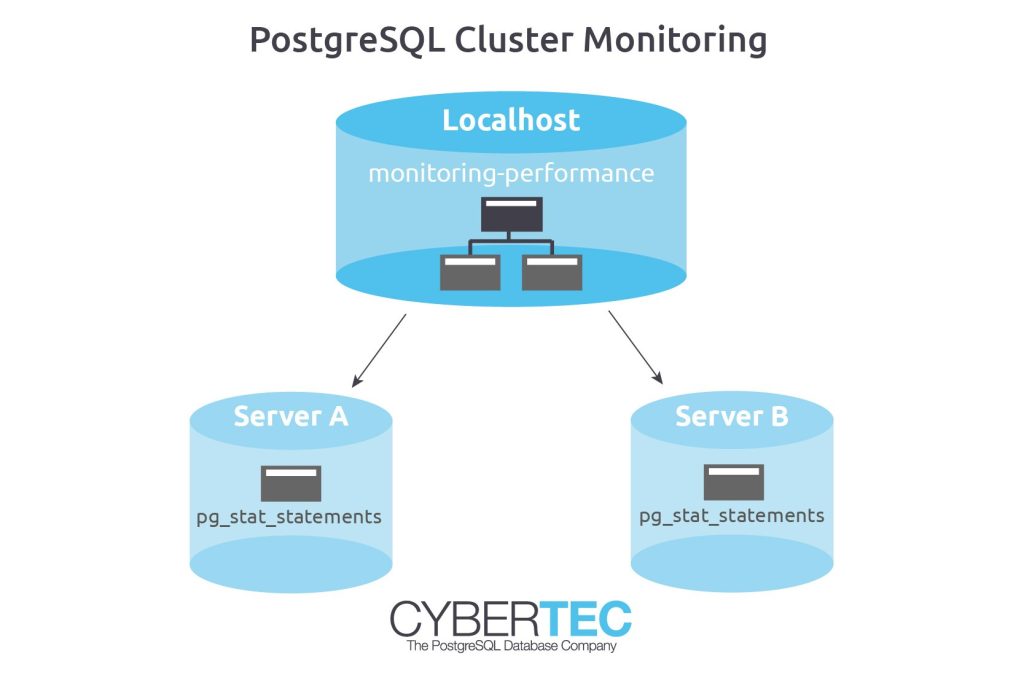
Our goal is to show data from a list of servers in a single view. One way to do that is to make use of PostgreSQL’s foreign data wrapper infrastructure. We can simply connect to all servers in the cluster and unify the data in a single view.
Let us assume we have 3 servers, a local machine, “a_server”, and “b_server”. Let us get started by connecting to the local server to run the following commands:
|
1 2 3 |
CREATE USER dbmonitoring LOGIN PASSWORD 'abcd' SUPERUSER; GRANT USAGE ON SCHEMA pg_catalog TO dbmonitoring; GRANT ALL ON pg_stat_statements TO dbmonitoring; |
In the first step I created a simple user to do the database monitoring. Of course you can handle users and so on differently, but it seems like an attractive idea to use a special user for that purpose.
The next command enables the postgres_fdw extension, which is necessary to connect to those remote servers we want to access:
|
1 |
CREATE EXTENSION postgres_fdw; |
Then we can already create “foreign servers”.
|
1 2 3 4 |
CREATE SERVER pg1 FOREIGN DATA WRAPPER postgres_fdw OPTIONS (host 'a_server', dbname 'a'); CREATE SERVER pg2 FOREIGN DATA WRAPPER postgres_fdw OPTIONS (host 'b_server', dbname 'b'); |
Just replace the hostnames and the database names with your data and run those commands. The next step is already about user mapping: It might easily happen that local users are not present on the other side, so it is necessary to create some sort of mapping between local and remote users:
|
1 2 3 4 5 6 7 |
CREATE USER MAPPING FOR public SERVER pg1 OPTIONS (user 'postgres', password 'abcd'); CREATE USER MAPPING FOR public SERVER pg2 OPTIONS (user 'postgres', password 'abcd'); |
In this case we will login as user “postgres”. Now that two servers and the user mappings are ready, we can import the remote schema into a local schema:
|
1 2 3 4 5 6 7 8 9 10 11 |
CREATE SCHEMA monitoring_a; IMPORT FOREIGN SCHEMA public LIMIT TO (pg_stat_statements) FROM SERVER pg1 INTO monitoring_a; CREATE SCHEMA monitoring_b; IMPORT FOREIGN SCHEMA public LIMIT TO (pg_stat_statements) FROM SERVER pg2 INTO monitoring_b; |
For each schema there will be a separate schema. This makes it very easy to drop things again and to handle various incarnations of the same data structure.
The last thing to do in our main database, is to connect those remote tables with our local data. The easiest way to achieve that is to use a simple view:
|
1 2 3 4 5 6 7 8 9 |
CREATE VIEW monitoring_performance AS SELECT 'localhost'::text AS node, * FROM pg_stat_statements UNION ALL SELECT 'server a'::text AS node, * FROM monitoring_a.pg_stat_statements UNION ALL SELECT 'server b'::text AS node, * FROM monitoring_b.pg_stat_statements; |
The view will simply unify all the data and add an additional column at the beginning.
Our system is now ready to use, and we can already start to run useful analysis:
|
1 2 3 4 5 6 7 8 |
SELECT *, sum(total_time) OVER () AS cluster_total_time, sum(total_time) OVER (PARTITION BY node) AS node_total_time, round((100 * total_time / sum(total_time) OVER ())::numeric, 4) AS percentage_total, round((100 * total_time / sum(total_time) OVER (PARTITION BY node))::numeric, 4) AS percentage_node FROM monitoring_performance LIMIT 10; |
The query will return all the raw data and add some percentage numbers on top of this data.
If you are interested in further information on pg_state_statements consider reading the following blog post too: /en/pg_stat_statements-the-way-i-like-it/
In order to receive regular updates on important changes in PostgreSQL, subscribe to our newsletter, or follow us on Facebook or LinkedIn.
Thanks!