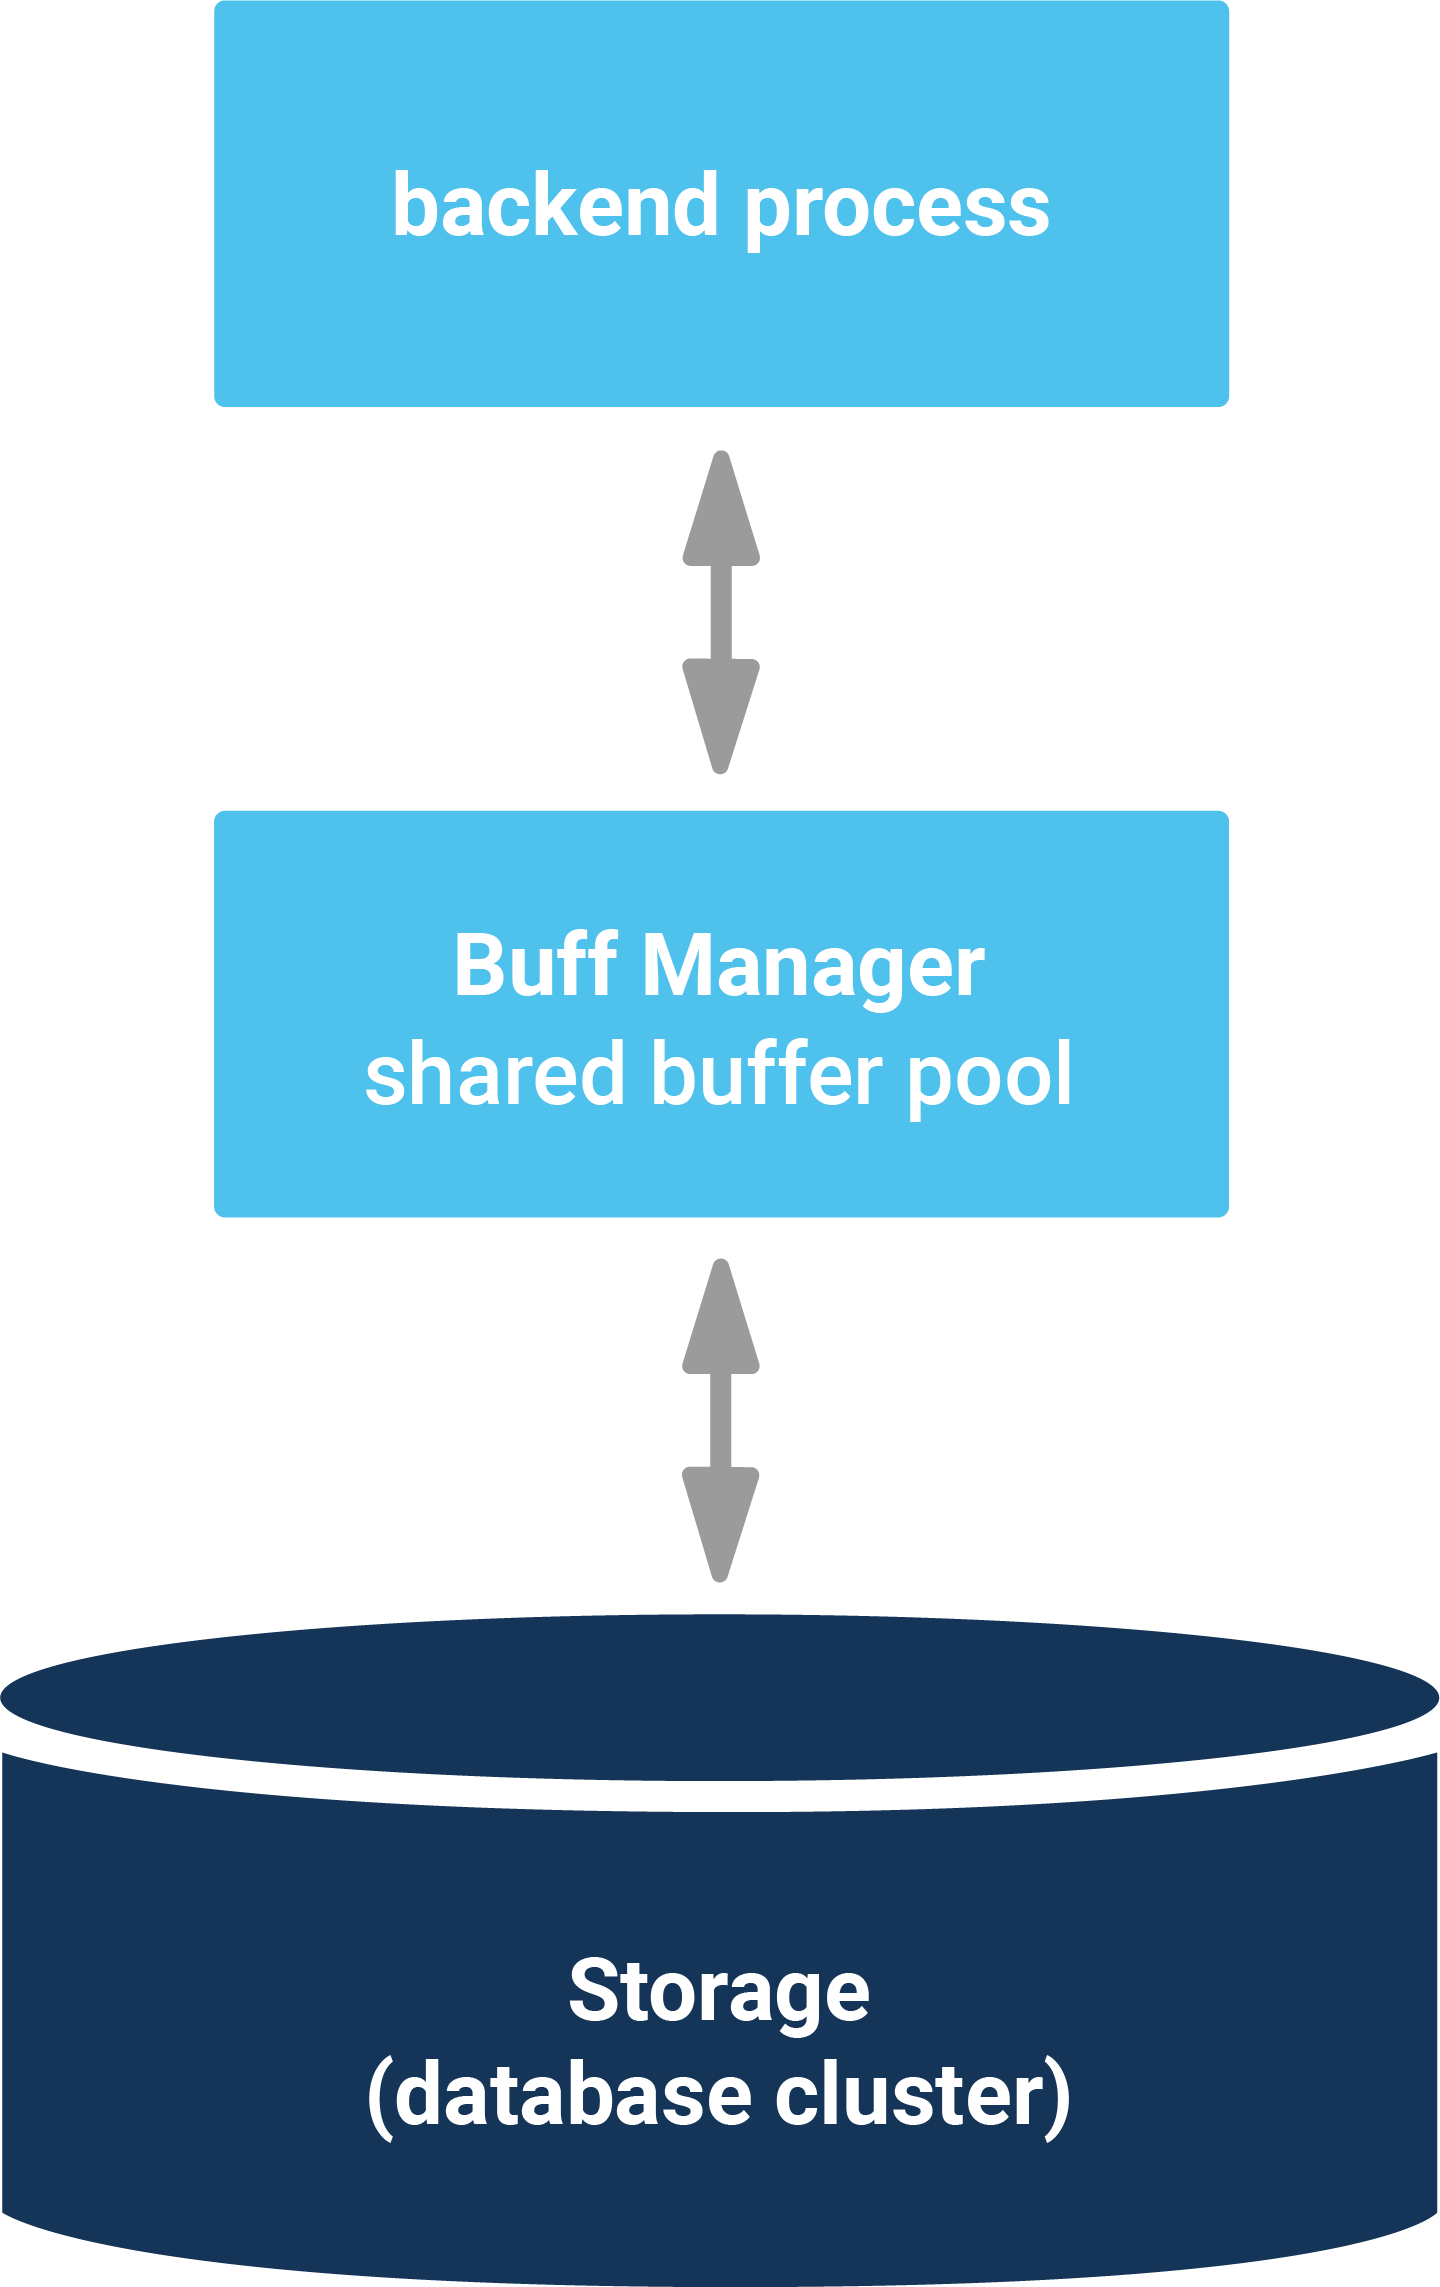
The PostgreSQL caching system has always been a bit of a miracle to many people and many have asked me during consulting or training sessions: How can I figure out what the PostgreSQL I/O cache really contains? What is in shared buffers and how can one figure out? This post will answer this kind of question and we will dive into the PostgreSQL cache.
Table of Contents
Before we can inspect shared_buffers, we have to create a little database:
|
1 |
hs@hansmacbook ~ % createdb test |
To keep it simple I have created a standard pgbench database containing 1 million rows, as follows:
|
1 2 3 4 5 6 7 8 9 10 11 12 13 14 15 16 17 18 19 20 21 |
hs@hansmacbook ~ % pgbench -i -s 10 test dropping old tables... NOTICE: table 'pgbench_accounts' does not exist, skipping NOTICE: table 'pgbench_branches' does not exist, skipping NOTICE: table 'pgbench_history' does not exist, skipping NOTICE: table 'pgbench_tellers' does not exist, skipping creating tables... generating data... 100000 of 1000000 tuples (10%) done (elapsed 0.14 s, remaining 1.25 s) 200000 of 1000000 tuples (20%) done (elapsed 0.27 s, remaining 1.10 s) 300000 of 1000000 tuples (30%) done (elapsed 0.41 s, remaining 0.95 s) 400000 of 1000000 tuples (40%) done (elapsed 0.61 s, remaining 0.91 s) 500000 of 1000000 tuples (50%) done (elapsed 0.79 s, remaining 0.79 s) 600000 of 1000000 tuples (60%) done (elapsed 0.92 s, remaining 0.62 s) 700000 of 1000000 tuples (70%) done (elapsed 1.09 s, remaining 0.47 s) 800000 of 1000000 tuples (80%) done (elapsed 1.23 s, remaining 0.31 s) 900000 of 1000000 tuples (90%) done (elapsed 1.37 s, remaining 0.15 s) 1000000 of 1000000 tuples (100%) done (elapsed 1.49 s, remaining 0.00 s) vacuuming... creating primary keys... done. |
Deploying 1 million rows is pretty fast. In my case it took around 1.5 seconds (on my laptop).
Now that we have some data, we can install the pg_buffercache extension, which is ideal if you want to inspect the content of the PostgreSQL I/O cache:
|
1 2 3 4 5 6 7 8 9 10 11 12 13 14 15 |
test=# CREATE EXTENSION pg_buffercache; CREATE EXTENSION test=# d pg_buffercache View 'public.pg_buffercache' Column | Type | Collation | Nullable | Default -------------------+----------+-----------+----------+--------- bufferid | integer | | | relfilenode | oid | | | reltablespace | oid | | | reldatabase | oid | | | relforknumber | smallint | | | relblocknumber | bigint | | | isdirty | boolean | | | usagecount | smallint | | | pinning_backends | integer | | | |
pg_buffercache will return one row per 8k block in shared_buffers. However, to make sense out of the data one has to understand the meaning of those OIDs in the view. To make it easier for you I have created some simple example.
Let us take a look at the sample data first:
|
1 2 3 4 5 6 7 8 9 10 |
test=# d+ List of relations Schema | Name | Type | Owner | Size | Description --------+------------------+-------+-------+---------+------------- public | pg_buffercache | view | hs | 0 bytes | public | pgbench_accounts | table | hs | 128 MB | public | pgbench_branches | table | hs | 40 kB | public | pgbench_history | table | hs | 0 bytes | public | pgbench_tellers | table | hs | 40 kB | (5 rows) |
My demo database consists of 4 small tables.
Often the question is how much data from which database is currently cached. While this sounds simple you have to keep some details in mind:
|
1 2 3 4 5 6 7 8 9 10 11 12 13 14 15 16 17 18 19 |
SELECT CASE WHEN c.reldatabase IS NULL THEN '' WHEN c.reldatabase = 0 THEN '' ELSE d.datname END AS database, count(*) AS cached_blocks FROM pg_buffercache AS c LEFT JOIN pg_database AS d ON c.reldatabase = d.oid GROUP BY d.datname, c.reldatabase ORDER BY d.datname, c.reldatabase; database | cached_blocks ---------------+--------------- postgres | 67 template1 | 67 test | 526 | 25 | 15699 (5 rows) |
The reldatabase column contains the object ID of the database a block belongs to. However, there is a “special” thing here: 0 does not represent a database but rather the pg_global schema. Some objects in PostgreSQL such as the list of databases, the list of tablespaces or the list of users are not stored in a database – this information is global. Therefore “0” needs some special treatment here. Otherwise, the query is pretty straightforward. To figure out how much RAM is currently not empty, we have to go and count the empty entries which have no counterpart in pg_database. In my example, the cache is not really fully populated, but mostly empty. On a real server with real data and real load, the cache is almost always 100% in use (unless your configuration is dubious).
There is one more question many people are interested in: What does the cache know about my database? To answer that question, I will access an index to make sure some blocks will be held in shared_buffers:
|
1 2 3 4 5 |
test=# SELECT count(*) FROM pgbench_accounts WHERE aid = 4; count ------- 1 (1 row) |
The following SQL statement will calculate how many blocks from which table (r) respectively index (relkind = i) are currently cached:
|
1 2 3 4 5 6 7 8 9 10 11 12 13 14 15 |
test=# SELECT c.relname, c.relkind, count(*) FROM pg_database AS a, pg_buffercache AS b, pg_class AS c WHERE c.relfilenode = b.relfilenode AND b.reldatabase = a.oid AND c.oid >= 16384 AND a.datname = 'test' GROUP BY 1, 2 ORDER BY 3 DESC, 1; relname | relkind | count -----------------------+---------+------- pgbench_accounts | r | 2152 pgbench_branches | r | 5 pgbench_tellers | r | 5 pgbench_accounts_pkey | i | 4 (4 rows) |
We deliberately exclude all relations with object ID below 16384, because these low IDs are reserved for system objects. That way, the output only contains data for user tables.
As you can see, the majority of blocks in memory originate from pgbench_accounts. This query is therefore a nice way to instantly find out what is in cache and what is not. There is a lot more information to be extracted, but for most use cases those two queries will answer the most pressing questions.
If you want to know more about PostgreSQL and performance in general, I suggest checking out one of our other posts in PostgreSQL performance issues, or take a look at our most recent performance blogs.
Leave a Reply