By Kaarel Moppel
Recently, I was asked for advice on how to reasonably implement a common task of table change tracking - meaning a so-called “audit trail” for all row changes over time was required. The keyword “compliance” might also ring a bell in this context, here for those who work in finance or for government institutions. But as always with technology, there are a couple of different approaches with different benefits / drawbacks to choose from; let’s lay it out for the Internet Citizens! There’s a summary of pros and cons down below if you’re in a hurry.
TL;DR: sadly, there are no real standard built-in tools for these types of tasks, but in real life it mostly boils down to creating some “shadow” tables and writing some triggers.
This server parameter named log_statement has 4 possible values - none, ddl, mod, all. By default, it’s configured conservatively (in this case, with ‘none’), as all PostgreSQL parameters generally are, in order to avoid accidentally wasting resources. That way, it doesn’t log normal SELECT or DML statements to the server log - only warnings and errors. But when set to ‘mod’ (or ‘all’ which is a superset of ‘mod’), all top level data-changing SQL statements (INSERT, UPDATE, DELETE, TRUNCATE) will be stored in the server log!
Make sure to note the “top level” part though - this means that if you have some business logic exercising triggers on your tables and a chain of changes is triggered, you’ll not see any traces of these subsequent changes in the server log! Also, log_statement doesn’t work well if you rely on stored procedures to change data - since they’re usually called via normal SELECT-s, which don’t get flagged as data-changing operations with the ‘mod’ log_statement level. Worse, if you need to do some dynamic SQL within your stored procedures - even the ‘all’ level won’t catch them!
In short - the use cases for the whole approach are somewhat limited to basic CRUD patterns, and log_statement is not necessarily suitable for enterprise requirements.
PS - also note that superusers can change this log_statement setting on the fly; thus bypassing the auditing, and do stuff secretly-- without any traces left! To remind you - “by design” with PostgreSQL, it’s never really possible to guard the system against a malicious superuser. Some methods just need some more work from the user, in short better be careful to whom you hand out superuser rights. Preferably, do not even allow remote superuser access, but that’s another topic - see here for more info, if you’re interested in security.
In short, pgaudit is a 3rd-party PostgreSQL extension that tries to improve on the quite limited default PostgreSQL text-based auditing / logging capabilities. It has been around for ages, so it’s stable enough to use, and there are even packages provided by PGDG repos for Debian / RH-based distros.
Its main drawback is the same as with the previous method, though - everything goes to the same server log with normal status / error messages. There’s no clear separation of “concerns”-- thus searching will be a bit of work, and for fast “trail” access, you probably need to parse the files and store them in some other system, properly indexed. It’s also the same story for the generated volume of logs. At default settings, (when just enabling all) it’s way more write heavy than the log_statement-based approach. In short, be sure to tune the plentiful parameters to your needs. To warn users about that, the project README also nicely says: … be sure to assess the performance impact while testing and allocate plenty of space on the log volume.
Custom audit tables and triggers must be the most classic / common approach to auditing, and all those working with RDBMS systems for a longer period have surely seen or implemented something like these features. The main idea - create a “shadow” history tracking / audit table for all relevant tables, where all changes to the main table will be logged, via triggers. However, since triggers are considered black magic by a lot of developers these days, I’ve also seen implementations via application code...but this can’t be recommended, as only in a non-existent perfect world are there no ad-hoc manual data changes.
The setup process here would look something like what you see below for every target table X, where we want to track who changed what rows / columns and when:
On a high level, this method is very similar to the previous one; the only change being that instead of having custom audit tables / trigger code for all “business” tables, we create a generic trigger function that can be used on all target tables, and that also logs all changes into a single table! By doing that, we’ve minimized the amount of table / code duplication - which could be of real value for big and complex systems - remember, DRY!
And how, you may wonder, would be the best way to implement it? Well, the best way to achieve such generic behaviour is to utilize the superb JSON functions of PostgreSQL, preferably the JSONB data type (available since v9.4), due to some space saving and faster search capabilities. BTW, if you happen to be running some earlier version, you should really think of upgrading, as versions 9.3 and lesser are not officially supported any more...and soon (February 13, 2020) PostgreSQL 9.4 will stop receiving fixes.
Since this approach is relatively unknown to the wider public, a piece of sample code probably wouldn’t hurt; check below for a sample. Note, however, that fiddling with JSONB along with the fact that this is basically a NoSQL type of storage, is not exactly as effective as normal tables / columns. You’ll have to pay a small performance and storage premium for this “generic” convenience.
|
1 2 3 4 5 6 7 8 9 10 11 12 13 14 15 16 17 18 19 20 21 22 23 24 25 26 27 28 29 30 |
CREATE TABLE generic_log ( mtime timestamptz not null default now(), action char not null check (action in ('I', 'U', 'D')), username text not null, table_name text not null, row_data jsonb not null ); CREATE INDEX ON generic_log USING brin (mtime); CREATE INDEX ON generic_log ((row_data->>'my_pk’)) WHERE row_data->>'my_pk' IS NOT NULL; // note the cast to text as JSONB can’t be indexed with B-tree CREATE EXTENSION IF NOT EXISTS btree_gin; CREATE INDEX ON generic_log USING gin (table_name); // GiN is better for lots of repeating values CREATE OR REPLACE FUNCTION public.generic_log_trigger() RETURNS trigger LANGUAGE plpgsql AS $function$ BEGIN IF TG_OP = 'DELETE' THEN INSERT INTO generic_log VALUES (now(), 'D', session_user, TG_TABLE_NAME, to_json(OLD)); ELSE INSERT INTO generic_log VALUES (now(), TG_OP::char , session_user, TG_TABLE_NAME, to_json(NEW)); END IF; RETURN NULL; END; $function$; CREATE TRIGGER log_generic AFTER INSERT OR UPDATE OR DELETE ON some_table FOR EACH ROW EXECUTE FUNCTION generic_log_trigger(); |
PS - note again, that with both of these trigger-based methods, superusers (or table owners) can temporarily disable the triggers and thus bypass our audit trail.
Logical replication, also known as “pub-sub” replication, is a relatively new thing in PostgreSQL (introduced in v10), and originally, not really an auditing feature but rather a near-zero-downtime upgrade mechanism (read this blog post with more details on that).
It can also be “abused” for auditing or CDC (Change Data Capture) purposes...and actually quite well! The biggest benefit - storage of any extra auditing data can be “outsourced” to an external system, and so-called “write amplification” can be avoided - meaning generally better performance, since extra writing to the disk happens somewhere else.
You need to choose between 2 implementation options though - PostgreSQL native or the custom application way
PostgreSQL native logical replication means that you build up a master server similarly structured to the original server, re-adjust the schema a bit - dropping PK/UQ-s, create some triggers that tweak or throw away uninteresting data or store it in “shadow” tables (just like with the normal trigger-based approaches) and then configure data streaming with CREATE PUBLICATION / CREATE SUBSCRIPTION commands.
As usual, some constraints still apply - you might need to alter the schema slightly to get going. Large objects (up to 4TB blobs) are not supported, and with default settings, you’d only be getting the primary key and changed column data, i.e. not the latest “row image”. Also, it’s generally more hassle to set up and run - an extra node and monitoring is needed, since the publisher and subscriber will be sort of “physically coupled”, and there will be operational risks for the publisher (source server) - if the subscriber goes on a ”vacation” for too long the publisher might run out of disk space as all data changes will be reserved and stored as transaction logs (WAL) until they’re fetched (or the slot deleted). The latter actually applies for the “custom application” approach. So you should definitely spend a minute in careful consideration before jumping into some implementations.
On a positive note from the security side - “PostgreSQL native” can actually be configured in such a way that it’s not even possible for superusers on the source system to disable / bypass the auditing process and change something secretly! (i.e. temporarily leaving out some tables from the replication stream so that the subscriber doesn’t notice!) However, this only works with the standard (for upgrades at least) FOR ALL TABLES setup.
The “application way” means using some programming language (C, Python, Java, etc) where the PostgreSQL driver supports logical decoding. You’ll always be streaming the changes as they happen, and then inspect or stash away the data in your favourite format, or propagate into some other database system altogether. See here for a sample PostgreSQL implementation that also can easily be tested on the command line. To simplify it a bit - you can live-stream JSON change-sets out of PostgreSQL and do whatever you like with the data.
| Approach | Pros | Cons |
| log_statement=’mod’ | Simplest way for basic requirements - just flip the built-in switch, even during runtime. | Text-based: volume and search can be problematic.
Captures only top level statements issued by users. Does not capture bulk update details. No table level configuration. |
| Pgaudit extension | Options to configure processing according to operation type and object / role.
Logs also dynamically generated statements. | Text-based: volume and search can be problematic.
Does not capture bulk update details. A 3rd party extension. |
| Explicit audit tables and triggers for all (relevant) tables | Less resources burnt than with text-based approaches.
Fast search. Easily customizable per table. | Write amplification.
Lots of code to manage and some structure duplication introduced. |
| A single audit table and trigger for all (relevant) tables | Less resources burnt than with text-based approaches.
Still a fast search. Customizable per table. | Write amplification.
Audit search queries might need some JSON skills. |
| Logical Replication | Least amount of resources burnt on the source system.
Highly customizable on object level. Can be well secured to guard data integrity. Fast search. | Complex setup.
Needs extra hardware / custom application. Typically requires some schema changes and extra care when the schema evolves. |
Hope you got some ideas for your next auditing project with PostgreSQL!
UPDATED 14.02.2023: pg_timetable is a brand-new job scheduler for PostgreSQL implemented completely from scratch (in Go). Traditional job scheduling is quite limited and does not cover all we needed in real life. Therefore, we thought about job execution in more detail and came up with a new concept that has not been seen in the PostgreSQL world before. pg_timetable does not simply execute some simple SQL statements periodically. It has been designed to execute entire sequences of operations at a time while offering some other important features we will discuss in this post.

You can run pg_timetable in 2 ways:
Both methods are described on our Github page so it should be easy for most people to run pg_timetable and to give it a try.
For the sake of simplicity we assume that you have installed our new PostgreSQL job scheduler and everything is up and running. So let's take a look and see how pg_timetable can be configured.
The core idea is to allow users to execute more complicated sequences of operations. Now what does that mean? Suppose you want to …
A sequence like that is quite common. Let us take a look at those steps in pg_timetable terminology: Each step on the way is a “base task”. There are various types of base tasks:
Those tasks can be combined and turned into chains. A base task can take parameters which are added at runtime. What does that mean? Suppose you want to send an email once a day. Who is going to receive this email? This kind of information can be passed to chains / base tasks scheduled for execution.
Let us take a look at an easy pg_timetable configuration examples:
|
1 2 3 4 5 6 7 8 9 10 11 12 13 14 15 16 17 18 19 20 21 22 23 24 25 26 27 28 29 |
-- Run public.my_func() at 00:05 every day in August: SELECT timetable.add_job('execute-func', '5 0 * 8 *', 'SELECT public.my_func()'); -- Run VACUUM at minute 23 past every 2nd hour from 0 through 20 every day: SELECT timetable.add_job('run-vacuum', '23 0-20/2 * * *', 'VACUUM'); -- Refresh materialized view every 2 hours: SELECT timetable.add_job('refresh-matview', '@every 2 hours', 'REFRESH MATERIALIZED VIEW public.mat_view'); -- Clear log table after pg_timetable restart: SELECT timetable.add_job('clear-log', '@reboot', 'TRUNCATE public.log'); -- Reindex at midnight on Sundays with reindexdb utility: -- using default database under default user (no command line arguments) SELECT timetable.add_job('reindex-job', '0 0 * * 7', 'reindexdb', job_kind := 'PROGRAM'); -- specifying target database and tables, and be verbose SELECT timetable.add_job('reindex-job', '0 0 * * 7', 'reindexdb', '['--table=foo', '--dbname=postgres', '--verbose']'::jsonb, 'PROGRAM'); -- passing password using environment variable through bash shell SELECT timetable.add_job(job_name := 'reindex-job', job_schedule := '0 0 * * 7', job_command := 'bash', job_max_instances := 1, job_exclusive := true, job_parameters := '['-c', 'PGPASSWORD=5m3R7K4754p4m'] reindexdb -U postgres -h 192.168.0.221 -v'::jsonb, job_kind := 'PROGRAM', job_self_destruct := false, job_ignore_errors := true, job_live := true); |
These are the simplest one-task chain examples, so-called jobs. A job is a chain with only one task according to our terminology.
Detailed description of the add_job() function is available in the manual.
If you want to see more complex multi-step chain examples, please, visit our Samples folder in the repo and appropriate Samples section in the manual.
Concurrency protection is an important aspect. Suppose you want to backup a database daily. What is going to happen if the backup takes 60 hours to complete? At some point, your server is going to die because jobs pile up. Or maybe backup files will start to overwrite each other. In short: If you want to make sure that only one backup at a time is allowed, pg_timetable concurrency protection is what you want. The max_instances = 1 setting is the easiest way to do that. There is no more need for pid files, no need for anything else. pg_timetable does it all for you.
More often than not, it happens that a job should only be done once. The idea is simple: Suppose somebody gets a 7-day free trial. After 7 days, you want to shut down the person's account. Obviously, shutting down somebody's account is not done daily - it happens once, and if the process was successful, that was basically it.
Self-destructive chains are especially useful for asynchronous execution. What do I mean by that? Suppose you have a website and you press a button to launch a job that runs for 2 hours. Clearly, nobody is going to sit in front of the browser window and wait. What you do instead is to tell pg_timetable to execute stuff as soon as possible and kill the job as soon as it is ended successfully. Asynchronous execution is the prime use case.
In case you're wondering how many simultaneous jobs can pg_timetable run in one session, we have two special examples for you: one simulates many parallel chains and another shows how to handle many tasks within a chain.
What is even better, the later shows you how to check the result code and output of a previous task. If the last task failed, that is possible only if ignore_error boolean = true is set for that task. Otherwise, a scheduler will stop the chain. This sample shows how to calculate failed, successful, and the total number of tasks executed. Based on these values, we can calculate the success ratio:
|
1 2 3 4 5 6 7 8 9 10 11 12 13 14 15 16 17 18 19 20 21 22 |
... [INFO] [chain:1] [task:497] [txid:499374] Starting task [INFO] [chain:1] [task:497] [txid:499374] Task executed successfully [INFO] [chain:1] [task:498] [txid:499374] Starting task [ERROR] [chain:1] [task:498] [sql:SELECT 1.0 / round(random())::int4;] [args:[]] [err:ERROR: division by zero (SQLSTATE 22012)] [pid:9616] [time:505.3µs] [txid:499374] Query [ERROR] [chain:1] [task:498] [error:ERROR: division by zero (SQLSTATE 22012)] [txid:499374] Task execution failed [INFO] [chain:1] [task:498] [txid:499374] Ignoring task failure [INFO] [chain:1] [task:499] [txid:499374] Starting task [INFO] [chain:1] [task:499] [txid:499374] Task executed successfully [INFO] [chain:1] [task:500] [txid:499374] Starting task [ERROR] [chain:1] [task:500] [sql:SELECT 1.0 / round(random())::int4;] [args:[]] [err:ERROR: division by zero (SQLSTATE 22012)] [pid:9616] [time:2.1592ms] [txid:499374] Query [ERROR] [chain:1] [task:500] [error:ERROR: division by zero (SQLSTATE 22012)] [txid:499374] Task execution failed [INFO] [chain:1] [task:500] [txid:499374] Ignoring task failure [INFO] [chain:1] [task:501] [txid:499374] Starting task [INFO] [chain:1] [task:501] [txid:499374] Task executed successfully [INFO] [chain:1] [task:1] [txid:499374] Starting task [INFO] [notice:Tasks executed:500; succeeded: 274; failed: 226; ratio: 54.8000000000000000] [severity:NOTICE] Notice received [INFO] [chain:1] [task:1] [txid:499374] Task executed successfully [INFO] [chain:1] [txid:499374] Chain executed successfully ... |
To make configuration easier, we have introduced a cron-style configuration interface:
|
1 2 3 4 5 6 7 8 9 |
-- CRON-Style -- * * * * * command to execute -- ┬ ┬ ┬ ┬ ┬ -- │ │ │ │ │ -- │ │ │ │ └──── day of the week (0 - 7) (Sunday to Saturday)(0 and 7 is Sunday); -- │ │ │ └────── month (1 - 12) -- │ │ └──────── day of the month (1 - 31) -- │ └────────── hour (0 - 23) -- └──────────── minute (0 - 59) |
But what if you want to have enhanced control over jobs? It's not that unusual one cannot foresee the execution time of some complicated operations, like REFRESH MATERIALIZED VIEW, CREATE INDEX CONCURRENTLY, etc. It's wise to run the next iteration after the some period, let say in an hour, or a day. In this case pg_timetable provides special interval format:
'@after 2 hours' will start the next chain iteration in two hours after the finish of the previous run;'@every 2 hours' will spin a new chain run every two hours no matter if and when the previous run is finished;'@reboot' value will run the chain at the very beginning of a pg_timetable session. Pay attention: not the server reboot! Rotate logs, install updates, check system status are the good examples of things you might want to do during start-up.If you like pg_timetable, we are looking forward to receive you feedback, or maybe even feature requests, bug reports and contributions. We also want to point out that commercial support for pg_timetable is available internationally.
If you want to read something else right now, we can recommend our post about pg_permissions which is available here.
It's been exactly half a year since the last major release of the pgwatch2 Open Source PostgreSQL monitoring tool, and I'm glad to announce that another huge set of useful features and improvements have found their way into the pgwatch2 code repository! The new version is incremented to v1.7 and, continuing the naming tradition, I'm also calling it "Feature Pack 6" as it's mostly about new features mixed with some bugfixes, although it's been surprisingly error-free for the last year. Note that listed below are only the most significant changes since last major version, v1.6, so please go through the GitHub changelog in detail if you're upgrading from a previous version.
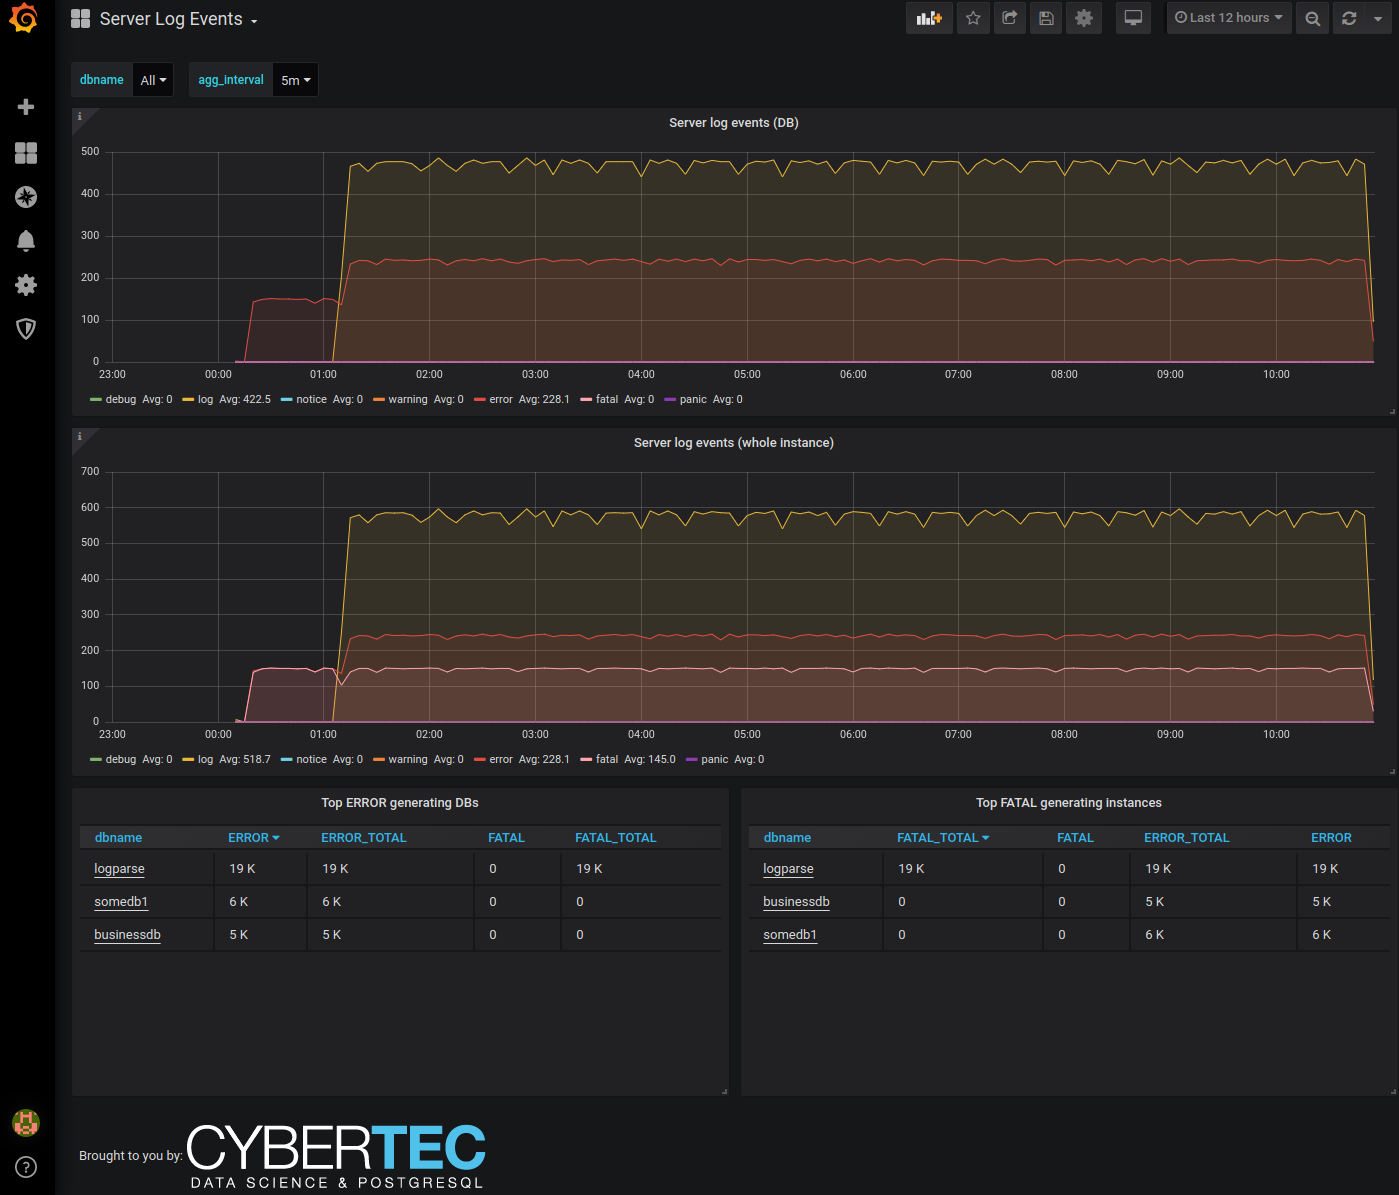
The biggest feature for me is the log parsing support. This means that when the pgwatch2 agent is deployed locally on the DB server (also called in "push" mode), it can "tail" the logs and send event counts to the metric store. And when is that useful? Well, mostly for all alerting and health-check purposes. Note that we're not storing error message contents to avoid security and performance problems, but only the event counts, grouped by severity.
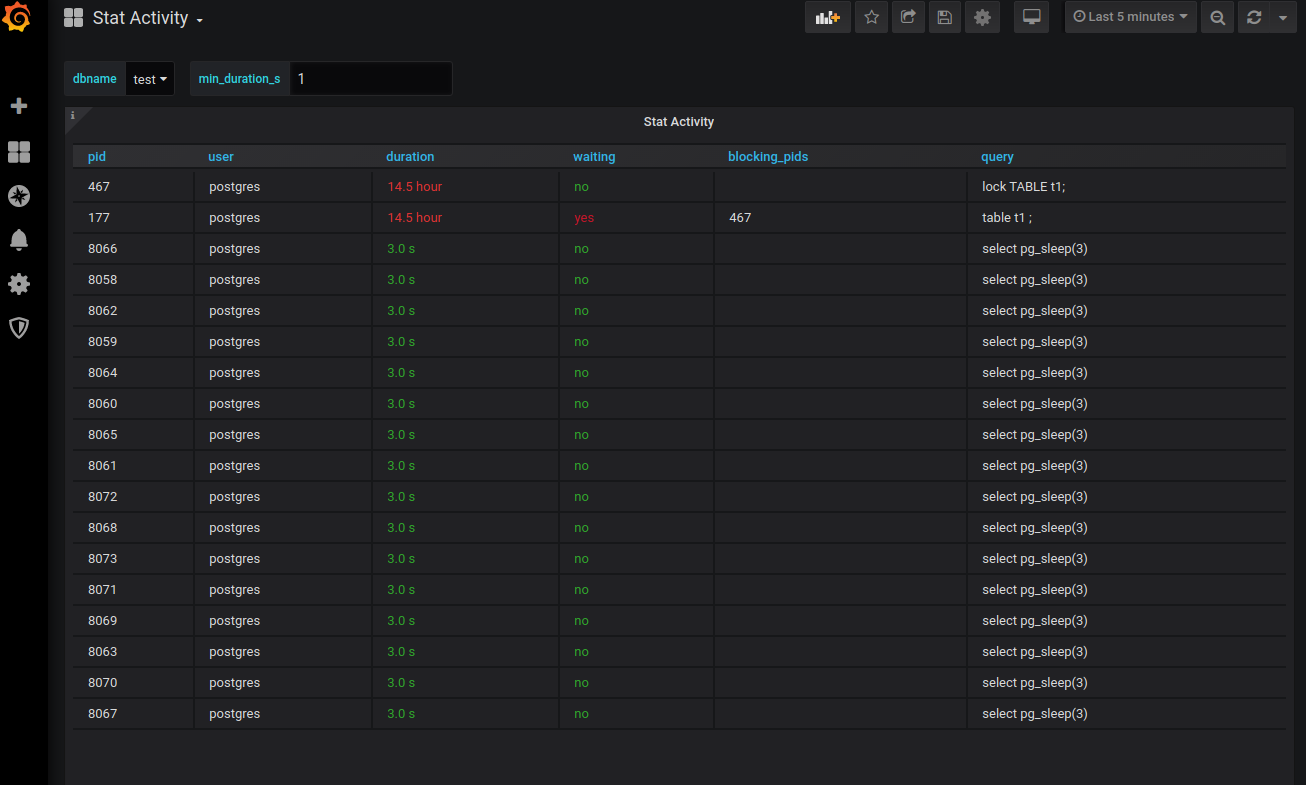
Other notable features are the "recommendations engine" and some infrastructure changes to treat metrics with "real-time" in their name a bit differently so that they could be executed very often (every second even) thus providing a near real-time glimpse into database activities, with the main practical usage of tracking live (currently executing) server processes conveniently there where all other metrics are viewed - in Grafana. Also included is possible locking info, utilizing "pg_stat_activity" and "pg_locks" data. But not only that – also for example live "explain plan" tracking for longer-lasting queries is now possible.
And as always, please do let us know on GitHub if you’re still missing something in the tool or are experiencing any operational difficulties - any feedback would be highly appreciated!
Logs are continuously parsed for errors, warnings, etc and these counts are regularly sent to the metric store. Assumes that the pgwatch2 collector is set up locally and has access to the log file folder – paths are auto-detected when sufficient privileges are there. Note that out-of-the-box it only works in conjunction with the CSVLOG log format (which is actually the best format if you don't plan to log absolutely all queries, events, etc as it can generate quite some volume then) – if you're not using that you need to provide a customized regex in Golang syntax.
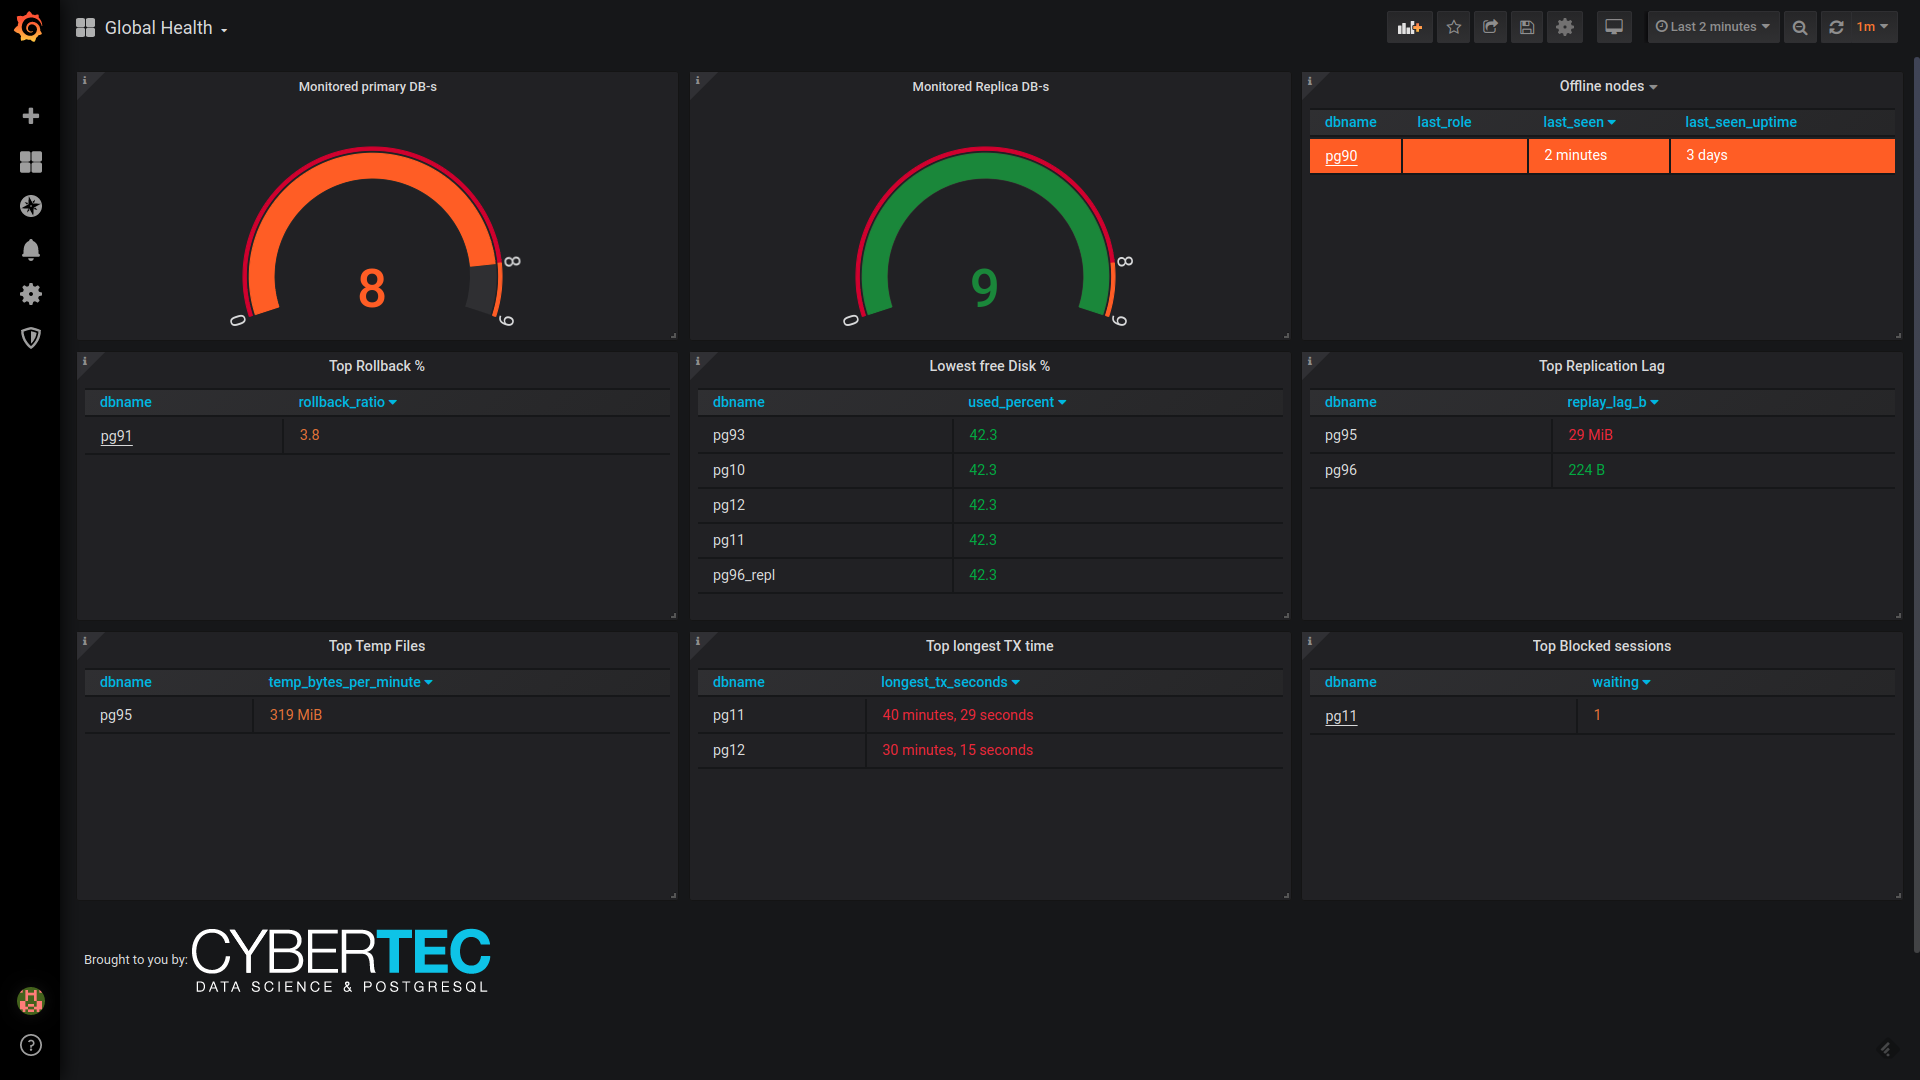
Some new metrics and a dashboards to list some common "best practice" violations like: too many superusers for possible threats, overly long-running queries, possible autovacuum issues, "untightened" security definer functions, "untightened" public schemas, unused indexes, too deeply nested views and also possibly missing indexes! The latter is based on the pg_qualstats extension which needs to be installed / configured independently on all target databases. But as the object of the recommendations / opinions is to allow that everyone to have their own view, the system is set up so that these recommendations can easily be extended / changed via SQL (as with normal metrics).
Well, near-real-time of course, as active session data (based on pg_stat_activity with additional locking info) first needs to be sent to the metric store and only then it's selected from Grafana as usual. But there are some optimizations on the storage level (unlogged tables, short partitions) so it should be fine with intervals in seconds. Note that as it still can be quite a "costly" feature, it's not included in the default "preset configs" and needs to be enabled separately – according metric is called "stat_activity_realtime". See below for a picture of the new dashboards.
Show the current PostgreSQL version for all monitored DBs, highlighting versions that are too old and out of the official support window. See below for a picture.
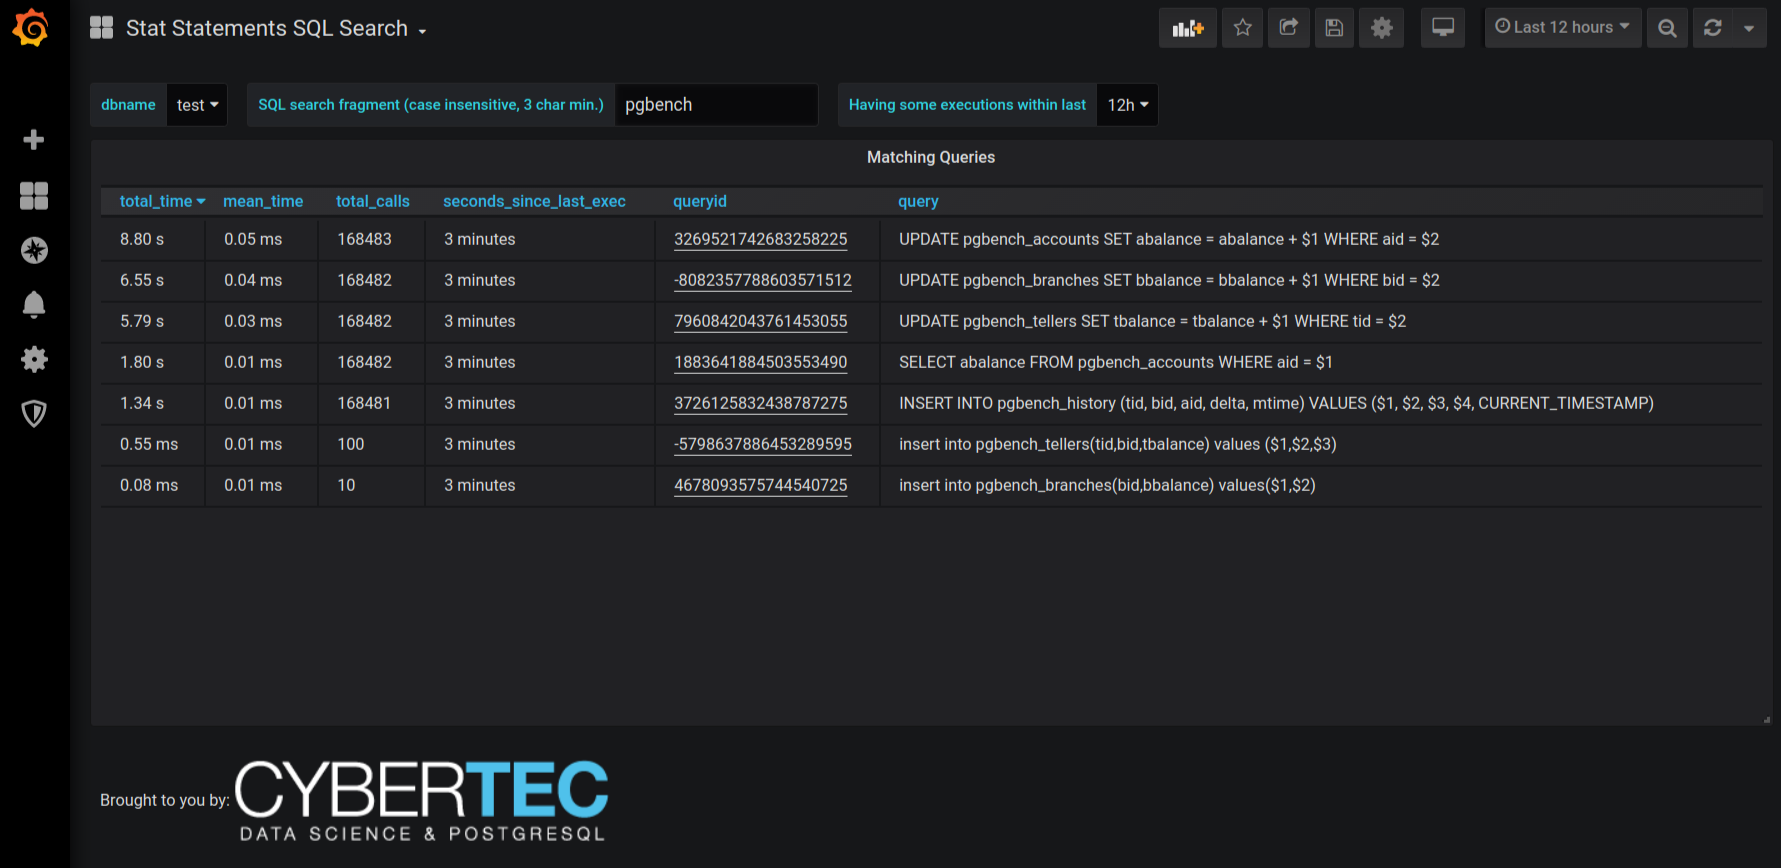
Shows execution statistics (runtime, calls, mean time) for queries matching some user-inputted SQL fragments. Note that this requires the "stat_statements" metric to be enabled and also remember that by default pgwatch converts queries to lower case and cuts off the end if it's more than 16k chars. See below for a picture.
As of now,for some metrics there are defined "direct access SQL-s" that superusers / pg_monitor roles can use so that less helper / wrapper functions are required for example if you're doing a local setup where the collector runs on the database server.
This means that the list of configured to-be-monitored DBs data is also present together with normal metrics data so that one can easily create downtime checks without cross-checking with the config DB / YAML files. See the "Global health" dashboard for a sample implementation (for Postgres metric store only).
If Python 2 is still required users need to replace the "plpython3u" line with "plpythonu" in metric fetching helpers.
Use the gatherer "--ping" flag to see that all configured (to be monitored) DB-s are reachable. No metrics are collected, and the program exits after these connection checks.
Rolling out the Config DB or Metrics DB schema or importing all pgwatch2 Grafana dashboards are now one-liners. Also the ready-made RPM / DEB / Tar packages now include the Grafana dashboards, so no internet connection is required after installing the packages.
This means it's easier to detect expensive "real" queries, coming from the users. For mostly idle systems it can actually happen that monitoring queries are the top time consumers. This behaviour can be also changed via a dropdown on the dashboard.
pgwatch2 is constantly being improved and new features are added. Learn more >>
Quite often when visiting customers or doing trainings, I see that people are quite happy seeing and learning about some little time-saving PostgreSQL tricks, commands or SQL snippets on the screen and they usually ask to slow down and explain or just say “wow, didn’t know you could do that”. As these tips and tricks are not too much material on their own, I thought I’d just make note of such titbits and write a post on that later - and now it seems that this “later” arrived 🙂 So below there is a list without any particular ordering on some Postgres features and tricks that I’ve gathered over the last year and that might be news for more casual Postgres users. Hope you’ll find something useful and a happy new Postgres year!
This could easily be the most useful one, especially for DBA-s doing some maintenance operations. Since a couple of years the PostgreSQL’s native query tool can do kind of “dynamic programming” - meaning you generate some SQL-s based on a queries output (i.e. the resultset is dynamic) and then you execute all of those generated SQL-s in sequence. Typical uses might be: “vacuuming” or gathering statistics for all the biggest tables that haven’t gotten any automatic “care” recently, getting row counts for all tables, generating thousands of tables for test purposes, rebuilding most bloated indexes, etc - in short stuff that previously required leaving the psql environment and writing a small script.
|
1 2 3 4 5 6 |
-- counting rows from all user tables dynamically select format('select count(*) from %s.%s', quote_ident(table_schema), quote_ident(table_name)) as sql from information_schema.tables where table_type ~ 'BASE' and not table_schema LIKE ANY(array[E'pg\_%', 'information_schema']) order by table_schema, table_name gexec |
Note that gexec is a psql command, not SQL!
Officially session level user variables are not really advertised in the documentation and not as convenient as in some other database systems (this might change in v13 with a proposed new “schema variables” feature) but it works, and they can be freely used in your applications when needed. How does it work? A small sample below:
|
1 2 3 4 5 6 7 8 9 10 11 12 13 |
/* setting variables */ SET myscope.var1 = 1; SET myscope.var2 = 'a'; -- notice that data types are not enforced SELECT set_config('myscope.var1', ‘3.14’, false); -- ‘false’ means session not transaction scope /* reading variables */ SHOW myscope.var2; myscope.var2 ────────────── a (1 row) SELECT current_setting('myscope.var1')::numeric * 10 as pi_x_10; |
The sleep functions are not overly useful and rather for demonstration purposes (creating some locking situations and then trying to find out who blocked whom) but after using the pg_sleep() function for years, that takes input in seconds, to my horror one day I discovered that there are more convenient functions that accept even human readable input!
|
1 2 3 4 |
SELECT now(); SELECT pg_sleep_for('5 minutes'); SELECT /* then do something …. */ SELECT pg_sleep_until('tomorrow 03:00'); |
This is not something that everyone can use, as the heyday of stored procedures is surely over, but they’re nevertheless very useful and performance friendly if applied in correct situations. So one transparent performance tuning aspect of stored procedures is that you can tune all the PostgreSQL configuration parameters available for your procedure of interest. It runs the fastest, without changing any application code or affecting any other queries / procedures. And this is actually a huge benefit and a serious argument to use stored procedures in a tiered / compartmentalized environment (think banks, etc). Code for such changes looks like:
|
1 2 3 |
ALTER FUNCTION f1(int) SET enable_seqscan TO off; ALTER FUNCTION f1(int) SET work_mem = '1GB'; ALTER FUNCTION f1(int) SET statement_timeout TO '5min'; |
There are a couple of different ways to achieve that (with pg_dump most commonly used) but actually the fastest way to duplicate databases is to use the CREATE DATABASE syntax with the TEMPLATE modifier. Something like:
|
1 2 |
CREATE DATABASE prod_app1_test TEMPLATE prod_app1; /* prod_app1 is the SOURCE db and prod_app1_test will be the new DUPLICATE */ |
What does this command do then? Well sadly on operational systems it will hang first...as the grave downside of the method is that it expects no active sessions on the copied DB - thus it’s not suitable for 24/7 live systems but for test systems or where some off-hours interruption is OK. But after terminating all sessions, it will binary copy all the existing files from the specified template DB into a new DB, thus no parsing, exporting, importing, building indexes. FYI - for snapshotting file systems like ZFS, Btrfs, EBS it can even be used during operation as the copy doesn’t cost initially anything there. So a more real life sample would look something like that:
|
1 2 3 4 5 6 |
SELECT count(*) FROM (select pg_terminate_backend(pid) from pg_stat_activity where datname = ‘prod_app1’) x; CREATE DATABASE prod_app1_test TEMPLATE prod_app1; # or from bash psql -qc 'select pg_terminate_backend(pid) from pg_stat_activity where datname = 'prod_app1'' && createdb -T prod_app1 prod_app1_test |
If we are already talking about test instances, or cases where for some reason you need a lot of instances on a single compute node i.e. multi-tenant on instance level or when running some test farms - there is a couple of quite unknown file locations that enable you to override the default configs and instance initialization parameters. Server configs should be (and mostly are) somehow versioned and managed, so I’ve used it rather to set initialization settings, namely enabling PostgreSQL side data checksums for new clusters. This cluster defaults file can be found at “/etc/postgresql-common/createcluster.conf” and I usually change only one line:
|
1 |
initdb_options = '-k' |
FYI - besides the default server config and initialization settings there are also some more cluster based files to customize the behaviour of “pg_ctl” (e.g. timeouts, restart mode) and service autostart behaviour, but the defaults there are quite sane.
PS this titbit only applies to Debian based systems (and PGDG repos i.e. the “official” packages from the Postgres project) and assumes that you use the according wrappers like “pg_createcluster”.
This is what around 98.375% of people find surprising - every PostgreSQL installation also has a bunch of sample configuration files on board, both for the server and client utilities! For example for those cases where you maybe accidentally erased some of them or you’re just curious what were the original defaults (although this can also be investigated via the pg_settings system view). For Debian based systems these files are located in “/usr/share/postgresql/$PGVER/” and for Redhat based ones in “/usr/pgsql-$PGVER/share/”.
A fun fact on config files - postgresql.conf is not even absolutely required as all settings have a default value compiled in! Only at least one access defining row in pg_hba.conf is required.
Back to SQL land.
* The TABLESAMPLE SQL command
Although fixed in SQL standard for a while (SQL standard 2003) and implemented in PostgreSQL years ago, the TABLESAMPLE clause still seems to be quite unknown. What does it do? Well, as the name implies, it helps us to quickly select a random test subset of a table’s data. Quite handy actually when data browsing, to get a feel for the schema at hand. There are 2 variations of the command in PostgreSQL where the BERNOULLI method could be substantially slower, so if “good randomness” is not important better prefer SYSTEM.
|
1 2 3 4 5 6 |
CREATE TEMP TABLE test (id int); INSERT INTO test SELECT * FROM generate_series(1, 1000000); -- 1 million rows /* a ~0.1% sample of rows - fast */ SELECT * FROM test TABLESAMPLE SYSTEM (0.1); /* a ~0.1% sample of rows - slower but more random */ SELECT * FROM test TABLESAMPLE BERNOULLI (0.1); |
* Good old random()
Another possibility that always works also for some very old Postgres versions and could be handy also for smallish tables and small sample percentages where TABLESAMPLE, being somewhat probabilistic, sometimes fails to select any rows at all. Warning - it will be slow for bigger tables and causes a sequential scan + expensive sort operation.
|
1 2 3 |
SELECT * FROM test ORDER BY random() LIMIT 10; /* or shaving off a couple of more “characters typed” with TABLE */ TABLE test ORDER BY random() LIMIT 10; |
* Crazy CTID stuff
For ultra-big data warehouse type of tables where good randomness is required on a regular basis for some weird reason, one could out-smart the slow TABLESAMPLE BERNOULLI with the following hack:
|
1 2 3 4 5 6 7 8 9 10 11 12 13 14 15 16 |
select * from ( select * from big_table where ctid in ( select format( '(%s,%s)', (relpages * random())::int, ((select reltuples / relpages from pg_class where relname = 'big_table') * random())::int )::tid from pg_class, generate_series(1, 200) rows /* need ca 2x more candidate tuples as avg page density still varies across pages */ where relname = 'big_table' ) ) x limit 100; |
If you grokked the above, you can feel good about your Postgres knowledge and have a small celebration break with soda pop or Club Mate 😀
To finish off - another very simple character saving tip when doing NULL comparisons:
|
1 2 3 4 |
-- usually written as SELECT * FROM tbl WHERE somecol IS NOT NULL; -- but this goes also SELECT * FROM tbl WHERE somecol NOTNULL; -- yay, 4 chars 'saved' |
This is a How-To blog about the PSQL_EDITOR variable. While trying to figure out all possible pitfalls, I've somehow managed to write a full blog post. You may skip to the summary though. All tests were done on Windows 10 with PostgreSQL 12 installed.
As you know, PostgreSQL ships with an interactive console tool named psql, which allows you to use a lot of enhanced features, like watching, for example. There is a lot of information about tweaking psql in POSIX environments. Still, there is a lack of such tips for Windows users. If you, my dear reader, are a Linux user, I'm sure you will also find this information useful anyway. Who knows what Microsoft's next purchase will be? After LinkedIn, GitHub, and Citus, you cannot be sure anymore! 😉
I've chosen Sublime as a target because it's not a simple console or single window application, but rather an advanced text processor with enhanced file handling, e.g. it restores unsaved files on startup.
PSQL_EDITOR - an environment variableAccording to the manual PSQL_EDITOR, EDITOR and VISUAL are environment variables, which are used inside psql to call an editor for input.
Let's try to set the environment variable then.
|
1 2 3 4 5 6 7 8 |
$ SET PSQL_EDITOR=C:Program FilesSublime Text 3subl.exe $ psql postgres=# e postgres=# e could not open temporary file 'C:Temppsql.edit.3288.sql': File exists |
As you can see, nothing was executed after the first e command, even though I've edited and saved the content of the query.
What's wrong here? First of all, I've used subl.exe instead of sublime.exe, which is special command line tool:
Sublime Text includes a command line tool, subl, to work with files on the command line. This can be used to open files and projects in Sublime Text, and also works as an EDITOR for unix tools, such as git and subversion.
psql runs the editor and then waits for the editor process to finish. But subl is a special tool, which in fact launches sublime.exe and then just dies. So psql gets a signal about subl, finishes and returns, but the temp file hasn't even been edited yet.
Next time you try to execute e, it reports on the temp file's existence.
Specifying
-wwill cause thesublcommand to not exit until the file is closed.
But the problem is: we cannot pass additional command line options in Windows:
|
1 2 3 4 5 6 7 8 9 |
$ SET PSQL_EDITOR=C:Program FilesSublime Text 3subl.exe -w $ psql -d postgres psql (12.1) Type 'help' for help. postgres=# e ''C:Program FilesSublime Text 3subl.exe -w'' is not recognized as an internal or external command, operable program or batch file. |
Let's try to examine the psql sources to find out if we can set PSQL_EDITOR to an arbitrary command line:
|
1 2 3 4 5 6 7 8 9 10 11 12 13 14 15 16 17 18 19 20 21 |
static bool editFile(const char *fname, int lineno) { ... /* * On Unix the EDITOR value should *not* be quoted, since it might include * switches, eg, EDITOR='pico -t'; it's up to the user to put quotes in it * if necessary. But this policy is not very workable on Windows, due to * severe brain damage in their command shell plus the fact that standard * program paths include spaces. */ ... if (lineno > 0) sys = psprintf(''%s' %s%d '%s'', editorName, editor_lineno_arg, lineno, fname); else sys = psprintf(''%s' '%s'', editorName, fname); ... } |
You can see now why we cannot include any arguments in the PSQL_EDITOR. It's quoted by default before execution on Windows.
The only additional environment variable available to configure editing is PSQL_EDITOR_LINENUMBER_ARG, but that won't help us here.
sublime_text.exe:|
1 2 3 4 5 6 7 8 9 10 11 12 13 |
$ SET PSQL_EDITOR=C:Program FilesSublime Text 3sublime_text.exe $ psql -d postgres psql (12.1) Type 'help' for help. postgres=# set ECHO queries postgres=# e select version(); version ------------------------------------------------------------ PostgreSQL 12.1, compiled by Visual C++ build 1914, 64-bit (1 row) |
This approach has one definite disadvantage. You need to close the Sublime editor, not only the tab with the file if you want to continue to work with psql. Assuming we're usually working with a lot of files simultaneously, that is a huge problem.
To keep all the advantages of Sublime Text, you may create a simple batch script in the home folder:
|
1 2 3 4 5 6 7 8 9 10 11 12 13 14 15 16 17 18 19 20 21 |
$ ECHO @ECHO OFF > %USERPROFILE%subl.bat $ ECHO 'C:Program FilesSublime Text 3subl.exe' --wait %* >> %USERPROFILE%subl.bat $ type %USERPROFILE%subl.bat @ECHO OFF 'C:Program FilesSublime Text 3subl.exe' --wait %* $ SET PSQL_EDITOR=%USERPROFILE%subl.bat $ psql -d postgres psql (12.1) Type 'help' for help. postgres=# set ECHO queries postgres=# e select version(); version ------------------------------------------------------------ PostgreSQL 12.1, compiled by Visual C++ build 1914, 64-bit (1 row) |
It works like a charm! You've just closed the tab and continued working with psql normally.
setenvIn the screenshot above, you may see a very common error people constantly make. They try to set EDITOR inside psql and use the SET command for that. SET is used for internal psql variables; to work with environment variables, you should use the setenv command. But this time, make sure you use proper quoting:
|
1 2 3 4 5 6 7 8 9 10 11 |
postgres=# setenv PSQL_EDITOR %USERPROFILE%subl.bat invalid command subl.bat Try ? for help. postgres=# setenv PSQL_EDITOR '%USERPROFILE%subl.bat' postgres=# e select version(); version ------------------------------------------------------------ PostgreSQL 12.1, compiled by Visual C++ build 1914, 64-bit (1 row) |
1. PSQL_EDITOR is the environment variable controlled by the shell. You should set it before calling psql or inside psql with the special command setenv
2. There are several synonyms available: PSQL_EDITOR, EDITOR, VISUAL
3. In Windows you cannot use an arbitrary shell command as a PSQL_EDITOR value, only the name or full path of the proper file (binary, batch, .cmd, etc), due to forced quoting within psql
4. If you need some complex command to be used, use a script for that (cmd, powershell) or create a shortcut with proper arguments.
To find out more about psql, see our other psql blogs here.
“out of shared memory”: Some of you might have seen that error message in PostgreSQL already. But what does it really mean, and how can you prevent it? The problem is actually not as obscure as it might seem at first glance. max_locks_per_transaction is the critical configuration parameter you need to use to avoid trouble.
“out of shared memory”: When it happensMost of the shared memory used by PostgreSQL is of a fixed size. This is true for the I/O cache (shared buffers) and for many other components as well. One of those components has to do with locking. If you touch a table inside a transaction, PostgreSQL has to track your activity to ensure that a concurrent transaction cannot drop the table you are about to touch. Tracking activity is important because you want to make sure that a DROP TABLE (or some other DDL) has to wait until all reading transactions have terminated. The trouble is, you have to store information about tracked activity somewhere-- and this point is exactly what you have to understand.
Let us run a simple script:
|
1 2 3 4 5 6 |
BEGIN; SELECT 'CREATE TABLE a' || id || ' (id int);' FROM generate_series(1, 20000) AS id; gexec |
What this script does is to start a transaction and to generate 20.000 CREATE TABLE statements. It simply generates SQL which is then automatically executed (gexec treats the result of the previous SQL statement as input).
Let us see what the SELECT statement produced ...
|
1 2 3 4 5 6 7 8 9 |
BEGIN ?column? ---------------------------- CREATE TABLE a1 (id int); CREATE TABLE a2 (id int); CREATE TABLE a3 (id int); CREATE TABLE a4 (id int); CREATE TABLE a5 (id int); ... |
|
1 2 3 4 5 6 7 8 9 10 |
... CREATE TABLE CREATE TABLE ERROR: out of shared memory HINT: You might need to increase max_locks_per_transaction. ERROR: current transaction is aborted, commands ignored until end of transaction block ERROR: current transaction is aborted, commands ignored until end of transaction block ERROR: current transaction is aborted, commands ignored until end of transaction block ERROR: current transaction is aborted, commands ignored until end of transaction block ... |
After a few thousand tables, PostgreSQL will error out: “out of shared memory”. What you can see is that we created all those tables in a single transaction. PostgreSQL had to lock them and eventually ran out of memory. Remember: The database is using a fixed-size shared memory field to store those locks.
The logical question is: What is the size of this memory field? Two parameters come into play:
|
1 2 3 4 5 6 7 8 9 10 11 |
test=# SHOW max_connections; max_connections ----------------- 100 (1 row) test=# SHOW max_locks_per_transaction; max_locks_per_transaction --------------------------- 64 (1 row) |
Keep in mind that row level locks are NOT relevant here. You can easily do a …
|
1 |
SELECT * FROM billions_of_rows FOR UPDATE; |
… without running out of memory because row locks are stored on disk and not in RAM. Therefore the number of tables is relevant – not the number of rows.
How can you figure out what is currently going on? To demonstrate what you can do, I have prepared a small example:
|
1 2 |
test=# CREATE TABLE t_demo (id int); CREATE TABLE |
First of all, you can create a simple table.
As you might know, in PostgreSQL names are not relevant at all. Internally, only numbers count. To fetch the object ID of a simple table, try the following statement:
|
1 2 3 4 5 6 7 |
test=# SELECT oid, relkind, relname FROM pg_class WHERE relname = 't_demo'; oid | relkind | relname --------+---------+--------- 232787 | r | t_demo (1 row) |
In my example, the object id is 232787. Let us figure out where this number pops up:
|
1 2 3 4 5 6 7 8 9 10 11 12 13 14 15 16 17 18 19 20 21 22 23 24 25 26 |
test=# BEGIN; BEGIN test=# SELECT * FROM t_demo; id ---- (0 rows) test=# x Expanded display is on. test=# SELECT * FROM pg_locks WHERE relation = '232787'; -[ RECORD 1 ]------+---------------- locktype | relation database | 187812 relation | 232787 page | tuple | virtualxid | transactionid | classid | objid | objsubid | virtualtransaction | 3/6633 pid | 106174 mode | AccessShareLock granted | t fastpath | t |
Since we are reading from the table, you can see that PostgreSQL has to keep an ACCESS SHARE LOCK which only ensures that the table cannot be dropped or modified (= DDL) in a way that harms concurrent SELECT statements.
The more tables a transaction touches, the more entries pg_locks will have. In case of heavy concurrency, multiple entries can become a problem.
If you are running a typical application, out of memory errors are basically rare because the overall number of relevant locks is usually quite low. However, if you are heavily relying on excessive partitioning, life is different. In PostgreSQL, a partition is basically a normal table-- and it is treated as such. Therefore, locking can become an issue.
Let us take a look at the following example:
|
1 2 3 4 5 6 7 8 9 10 11 12 |
BEGIN; CREATE TABLE t_part (id int) PARTITION BY LIST (id); SELECT 'CREATE TABLE t_part_' || id || ' PARTITION OF t_part FOR VALUES IN (' || id || ');' FROM generate_series(1, 1000) AS id; gexec SELECT count(*) FROM t_part; |
First of all, a parent table is created. Then, 1000 partitions are added. For the sake of simplicity, each partition is only allowed to hold exactly one row-- but let’s not worry about that for now. Following that, a simple SELECT statement is executed—such a statement is guaranteed to read all partitions.
The following listing shows which SQL the script has generated to create partitions:
|
1 2 3 4 5 6 7 8 |
?column? -------------------------------------------------------------------- CREATE TABLE t_part_1 PARTITION OF t_part FOR VALUES IN (1); CREATE TABLE t_part_2 PARTITION OF t_part FOR VALUES IN (2); CREATE TABLE t_part_3 PARTITION OF t_part FOR VALUES IN (3); CREATE TABLE t_part_4 PARTITION OF t_part FOR VALUES IN (4); CREATE TABLE t_part_5 PARTITION OF t_part FOR VALUES IN (5); ... |
After running the
|
1 |
SELECT count(*) FROM t_part |
statement, the important observation is now:
|
1 2 3 4 5 6 7 |
SELECT count(*) FROM pg_locks WHERE mode = 'AccessShareLock'; count ------- 1004 (1 row) |
PostgreSQL already needs more than 1000 locks to do this. Partitioning will therefore increase the usage of this shared memory field and make “out of memory” more likely. If you are using partitioning HEAVILY, it can make sense to change max_locks_per_transaction.
In case you are interested in Data Science and Machine Learning, you can check out Kevin Speyer’s post on “Reinforcement Learning” which can be found here.
In order to receive regular updates on important changes in PostgreSQL, subscribe to our newsletter, or follow us on Facebook or LinkedIn.