As a little boy, I dreamed of becoming a supersonic jet pilot or an astronaut. I also yearned to pilot trains, subways, trolleybuses, trams, and other vessels. I remember stealing pot lids from my grandparent's kitchen to make a steering wheel. And also all sorts of devices and tools to emulate the cockpit dashboard. My childish mind easily turned a hammer into a landing gear release lever. Clothes pegs quickly served as switches to open the airlocks.
Table of Contents
That could be one of the reasons why I have fun times being the pgwatch maintainer. After all, one of the duties is to maintain Grafana dashboards, which are widely used for monitoring and visualization. Today, I want to introduce an updated dashboard to monitor pg_timetable scheduled jobs.
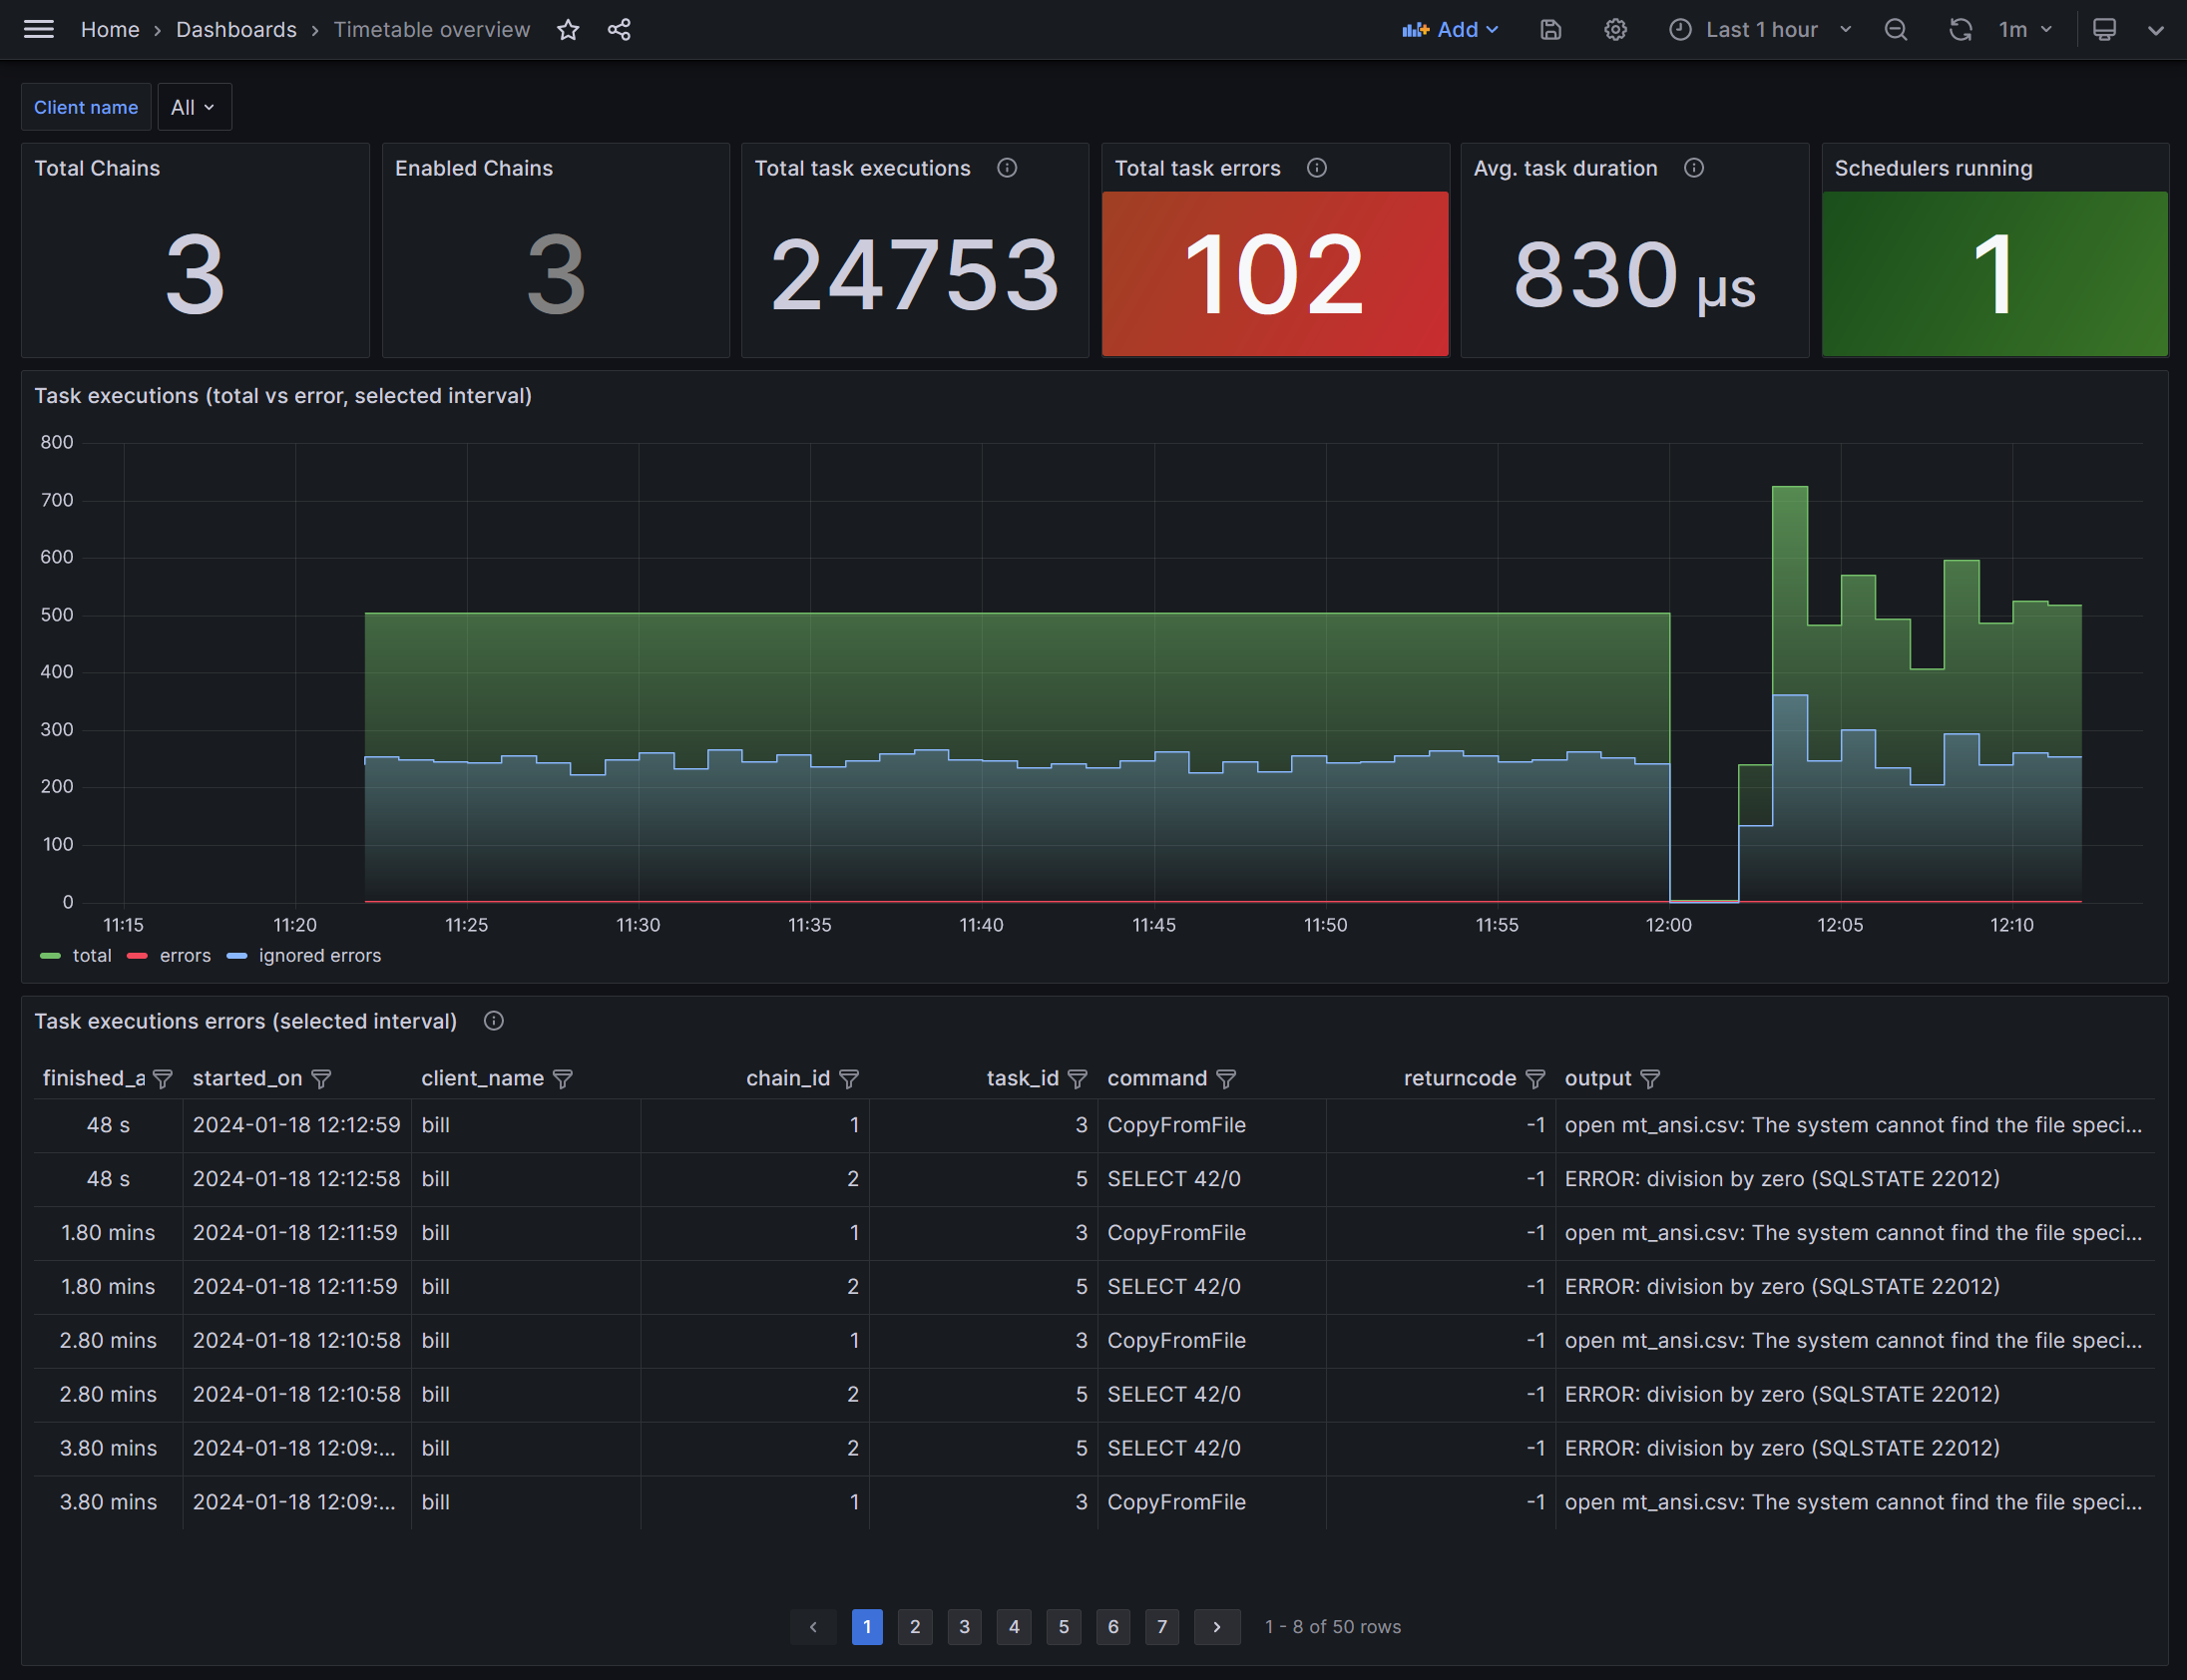
Let me describe all the elements on this dashboard.
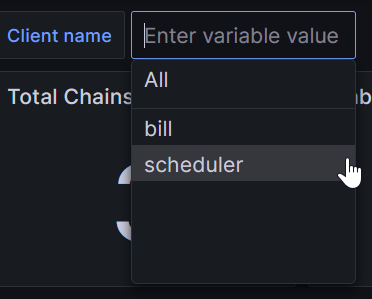
The "Client name" drop-down list allows you to filter data only for selected pg_timetable clients. By default, all client sessions are displayed.
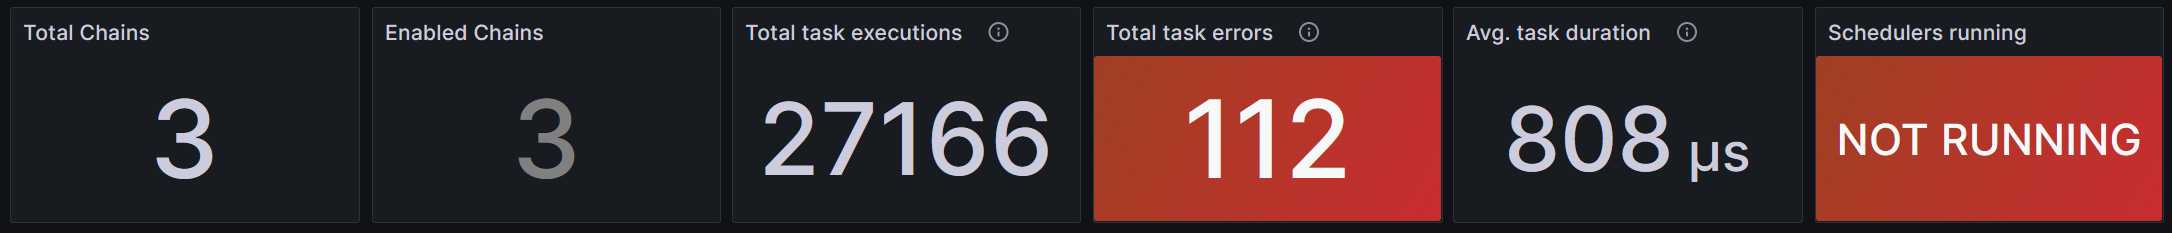
The "Schedulers running" panel indicates in "real-time" how many pg_timetable instances are running and connected to the current database. This panel is an excellent choice to create an alert based on it. If you prefer the direct query, then use this one:
|
1 2 3 4 |
SELECT count(DISTINCT client_name) from timetable.active_session |
The "Total chains" panel shows you how many chain definitions are available in the system, including paused. One can get this value simply by executing:
|
1 2 3 4 |
SELECT count(*) FROM timetable.chain |
On the contrary, the "Enabled chains" panel displays how many jobs the client can execute. If the "Client name" value is "All," this panel indicates the total number of all non-paused chains. This query allows you to get such a piece of information directly:
|
1 2 3 4 5 6 |
SELECT count(*) FROM timetable.chain WHERE live AND client_name ISNULL or client_name IN ('bill', 'scheduler') |
Please note that if client_name is null here, all running schedulers can execute such a chain.
All following panels are affected by the "Client name" and the time interval selected in the top bar, e.g., "Last 1 hour".
The "Total task executions" panel represents the number of tasks executed by the specified client(s) during the selected time frame. Pay attention; we are talking about tasks here, not chains. We want such a granularity here because some chains may consist of several tasks. To get this value directly, one can run such a query:
|
1 2 3 4 5 6 |
SELECT count(*) FROM timetable.execution_log WHERE last_run BETWEEN '2024-01-18T10:10:00Z' AND '2024-01-18T11:30:00Z' and client_name in ('bill','scheduler') |
We examine timetable.execution_log here. That means the client_name column will definitely indicate the runner. The last_run column holds the start time of a task. If you're looking for the time when a task was finished, use a corresponding finished column.
The "Total task errors" panel shows how many tasks the selected client(s) failed during the time frame chosen. This number, however, doesn't include failures of tasks with the timetable.task.ignore_error column set to true. Remember to tune the panel thresholds. By default, 0 (no errors) is shown as green, 1-10 errors are colored orange, and more than that are painted red.
To get this information directly, use such the query:
|
1 2 3 4 5 6 7 8 9 |
SELECT count(*) FROM timetable.execution_log WHERE last_run BETWEEN '2024-01-18T10:10:00Z' AND '2024-01-18T11:30:00Z' AND returncode != 0 AND NOT COALESCE(ignore_error, false) AND client_name in ('bill', 'scheduler') |
The "Average task duration" panel displays the average duration of successful tasks during the selected interval. There are no predefined thresholds set for this panel. You should probably apply some based on your specific workflows. To collect this value, we use the query like this:
|
1 2 3 4 5 6 7 8 |
SELECT avg(finished - last_run) FROM timetable.execution_log WHERE last_run BETWEEN '2024-01-18T10:10:00Z' AND '2024-01-18T11:30:00Z' AND returncode = 0 AND client_name in ('bill', 'scheduler') |
The "Task executions (total vs error)" graph provides detailed execution information for the selected time interval. The visualization consists of bars indicating a heartbeat of the pg_timetable equal to 1 minute. For example, from the graph provided above, we can tell:
If you want to examine these trends in your favorite SQL client, start with such code snippet:
|
1 2 3 4 5 6 7 8 9 10 11 |
SELECT date_trunc('minute', finished) as time, count(*) as total, count(*) FILTER (WHERE returncode != 0 AND NOT COALESCE(ignore_error, false)) as errors, count(*) FILTER (WHERE returncode != 0 AND ignore_error) as 'ignored errors' FROM timetable.execution_log WHERE finished BETWEEN '2024-01-18T10:10:00Z' AND '2024-01-18T11:30:00Z' AND client_name in ('bill', 'scheduler') GROUP by 1 |
The bottom last "Task executions errors" grid lets you see all non-ignored task errors for the selected interval. This grid is a detailed view of the previously discussed "Total task errors" panel.
If you want to contribute to pg_timetable and help to make it better:
In conclusion, I wish you all the best! 💙💛
See you soon in person at one of the conferences, meetups, or training sessions!
Leave a Reply