We have written about our hatchling Open Source PostgreSQL monitoring tool called pgwatch2 some months ago here and here but now I think it deserves another nudge, as a lot of new features have found their way into the code.
Table of Contents
For our new readers - pgwatch2 is a simple but flexible Postgres monitoring tool, aiming to provide a nice balance between features / usability / out-of-the-box experience, concentrating on nice graphs using Grafana. Getting started with pgwatch2 by the way couldn't be any easier and takes just minutes thanks to Docker - please check the links from above for more details.
So, find a listing of those new features below. Please feel free to check out the new version and let us know on GitHub if you're still missing something in the tool or are having difficulties with something! Thanks a lot!
Project GitHub link - here
Previously, only InfluxDB was supported as metrics storing datastore - now when running the pgwatch2 daemon it is possible to specify that metrics should be stored also in Graphite. Use --datastore / --graphite-host / --graphite-port parameters for that. Metrics will be stored in the "pgwatch2" namespace then. Sadly there are no out of the box dashboards for Graphite though, so you need to compose them manually, based on Influx ones...
Previously one could really recommend out-of-the-box image only for local / LAN / datacenter usage, but now with SSL support one can expose both the Web UI (configure the gathered metrics and hosts) and Grafana (graphs on gathere metrics) also over the Internet, given you'll set some strong passwords of course. New self-signed (aka snake oil) SSL cert will generated on every container startup when the below flags are set, so it should be relatively OK.
|
1 |
docker run ... -e PW2_WEBSSL=1 -e PW2_GRAFANASSL=1 --name pw2 cybertec/pgwatch2 |
New SQL text versions for some metrics. Has mostly to do with "*xlog*" functions renamed to "*wal*".
This had actually to do only with reading/transforming the Postgres server version number universally.
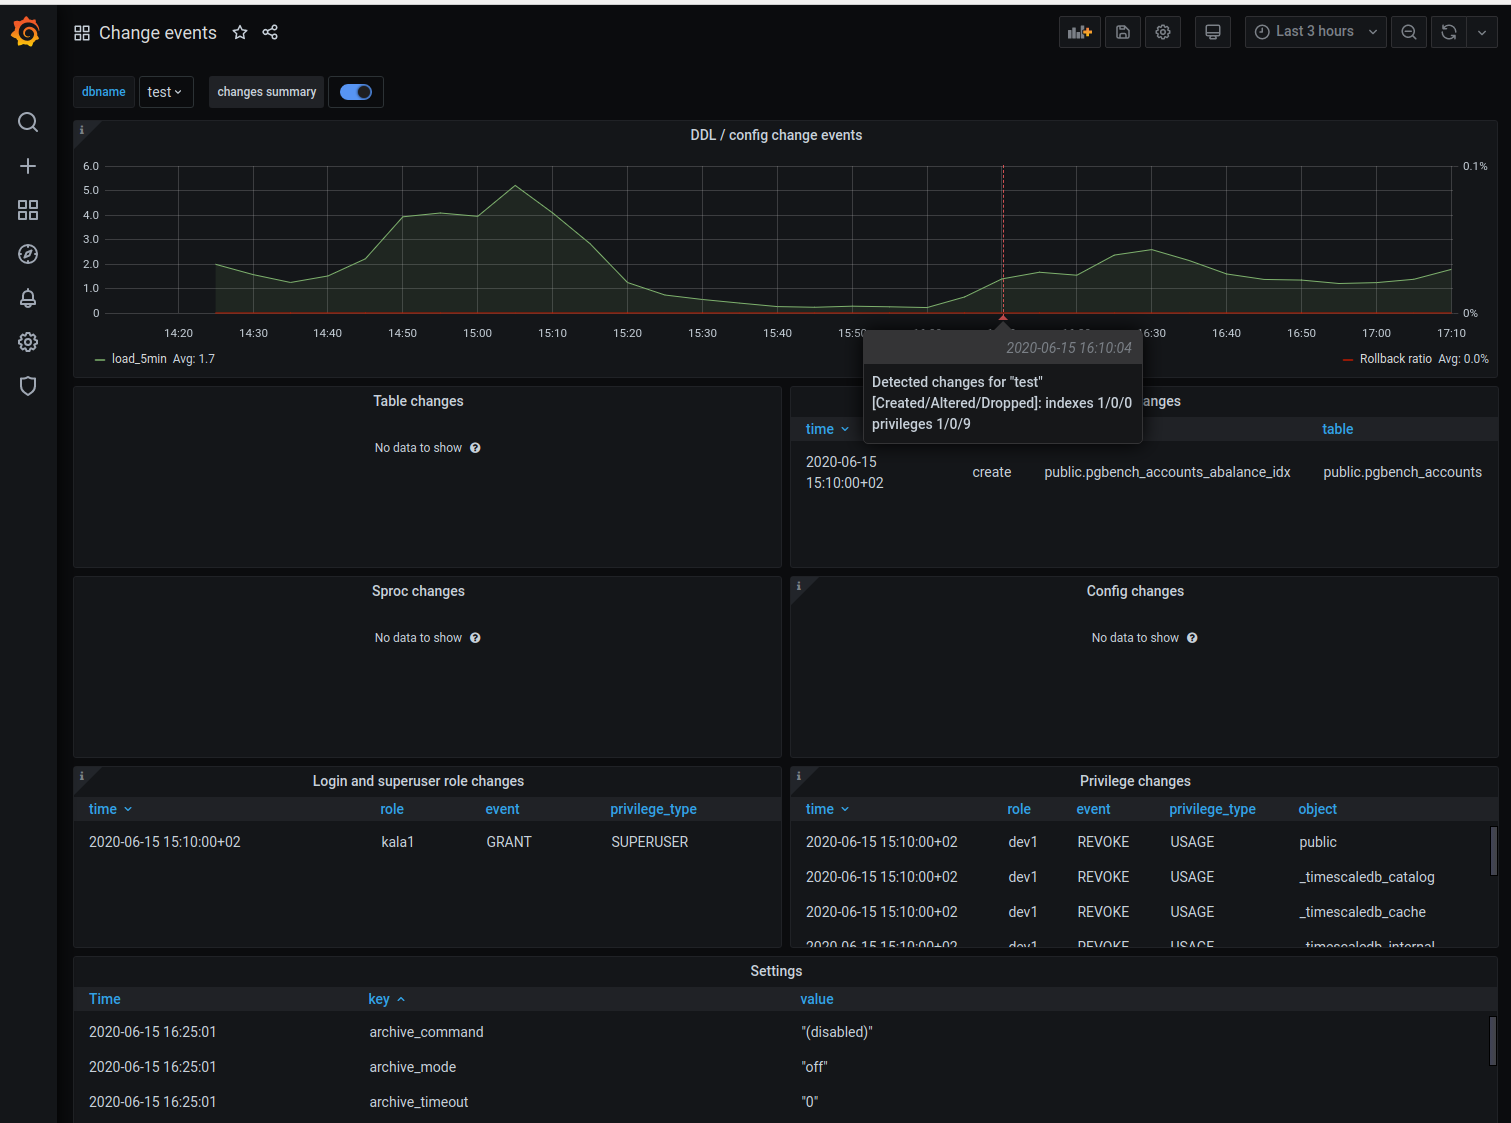
When the new "change_events" metric is enabled, the pgwatch2 daemon will track the signature of tables/views/indexes, stored procedure code and values of server configuration parameters and will log an "change event" when any changes detected. These events graphed together with the "CPU load" and "Rollback ratio" graphs should help to quickly pinpoint problems arising from new schema rollouts or config changes by the DBAs.
The daemon is now complied inside the Docker. This increases of course the image size but makes experimenting and small behaviour adjustments easier.
Histograms and heatmaps now possible! See demo here.
More info on backup/restore and metrics setup.
pgwatch2 is constantly being improved and new features are added. Learn more.
Leave a Reply