With summer fading away it's time to get busy again. During the last couple of weeks, I've taken time to work on our Open Source PostgreSQL monitoring tool pgwatch2 and added another batch of useful management / scaling features and some more minor enhancements. Those were requested by a couple of bigger organizations who are using the tool on a larger scale as well as by the GitHub queue. By the way, this is already the 4th "Feature Pack" in one and a half years, so after having implemented the below features we're considering the software now "ripe", with no important features missing. Also we're glad that quite some people have given their feedback recently, helping to improve the software even further and thus hopefully helping to provide more value to the PostgreSQL community. But read on for a more detailed overview on the most important features from this v1.4.0 update.
Table of Contents
Similar to the last update, we have tried to make pgwatch2 easier to deploy on a larger scale. This time there is nothing new on the containerization front though, but we've added the possibility to make repeatable, configuration-based deployments possible! Meaning - one can add a config file(s) with connect strings, metric selections / intervals and the metric definitions themselves to some version control / configuration management / application deployment system and deploy the metrics collector easily to each required DB node, pushing metrics directly to InfluxDB or Graphite. This also works better also for firewalled environments.
The previously supported centrally managed metrics gatherer / configuration database approach works as before, but in case the amount of servers gets too large (hundreds and above) to be handeled by one central gatherer without lag, one can now add a logical grouping label to the monitored hosts and then deploy separate gatherers for subset(s) of hosts based on that label. There are also other performance changes like batching of metric storage requests and connection pooling, helping to increase throughput.
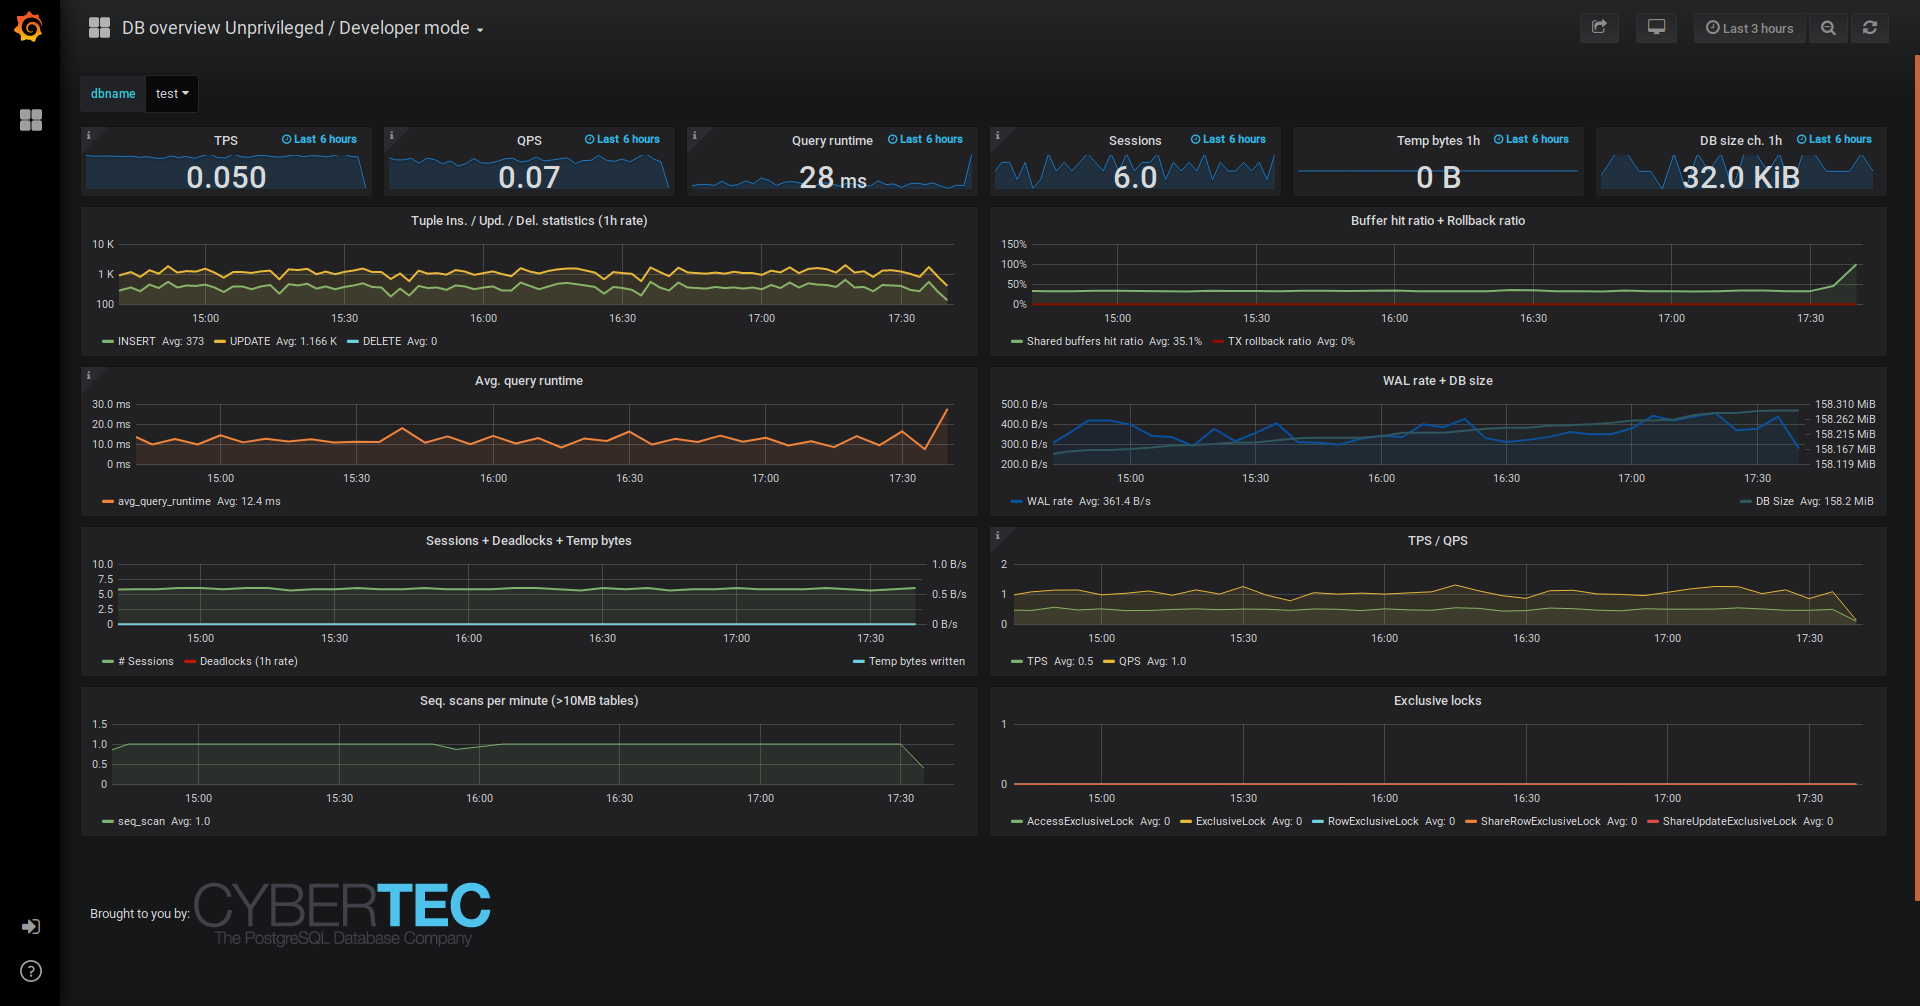
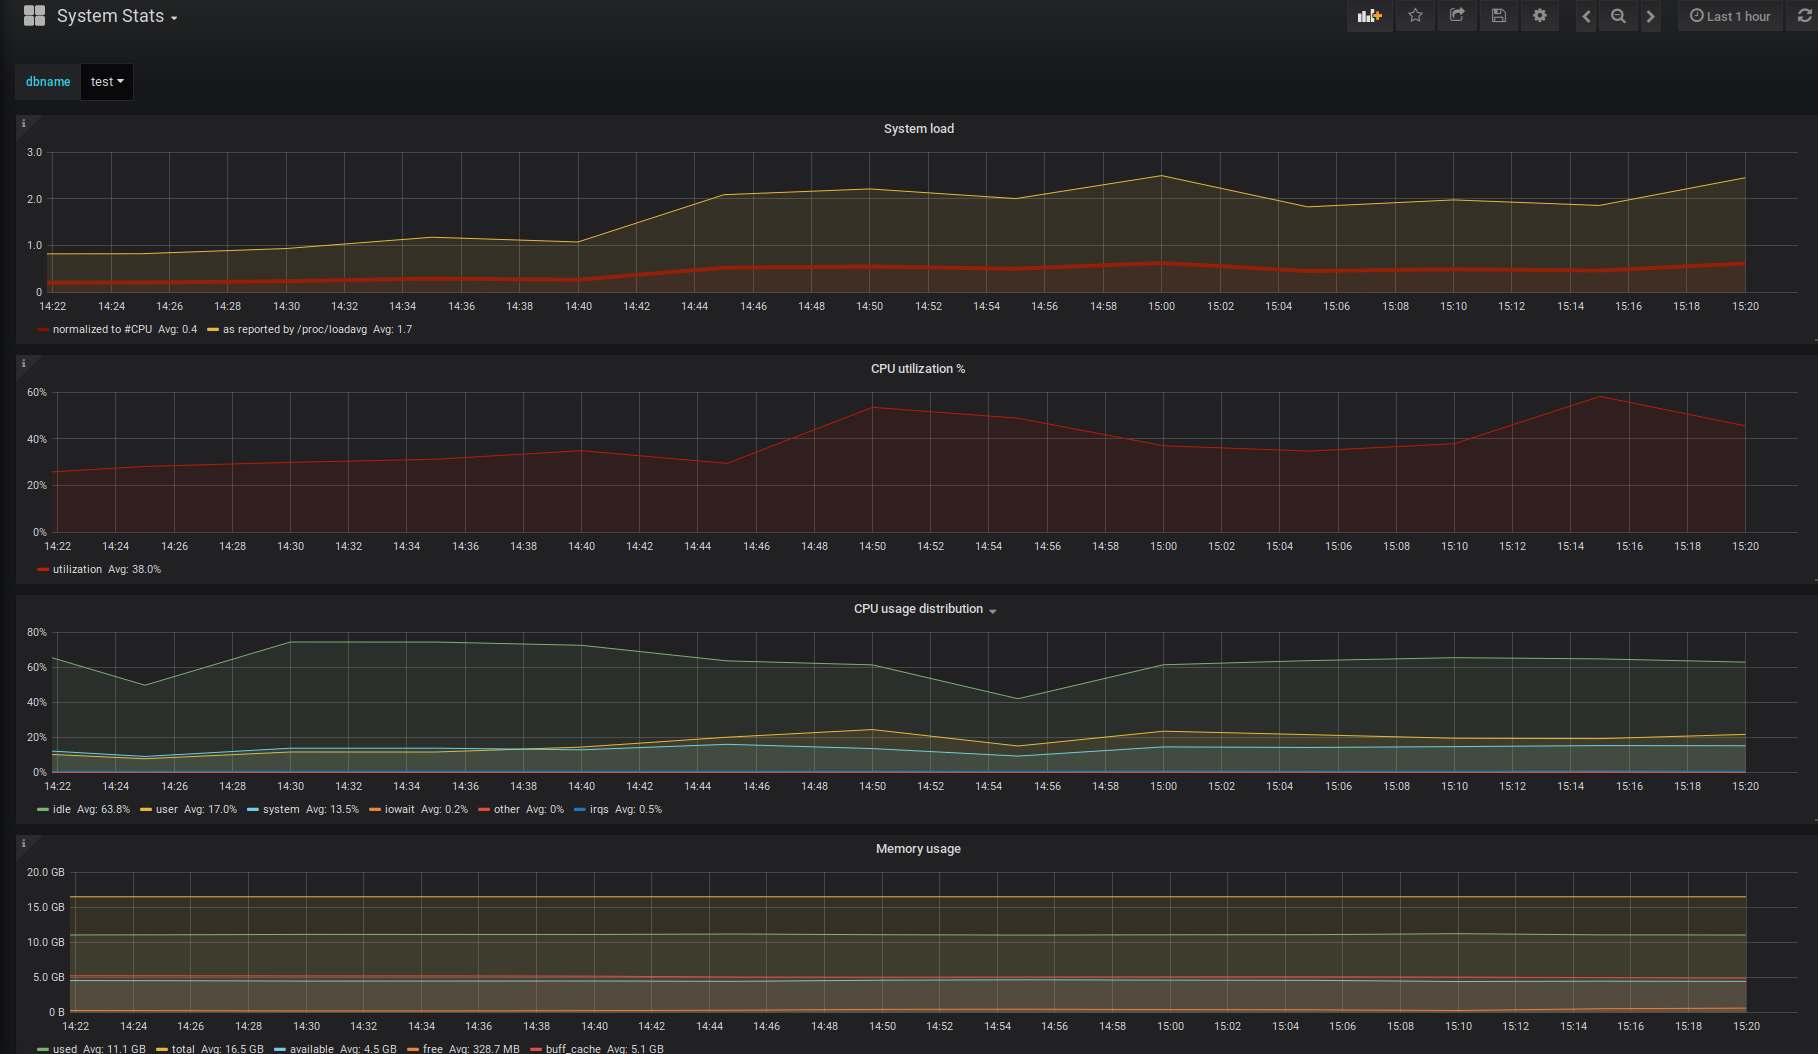
As usually, there are also a couple of new pre-defined metrics, most notably "psutil" based system statistics (CPU, RAM, disk information), 2 "preset configs" (the "unprivileged" one for regular login user / developers might be the most useful) and new dashboards to go along with those metrics. As a reminder – one doesn't need to work with the provided dashboards "as is", but they can just be used as templates or inspiration source for user modifications.
Some other dashboards (e.g. DB overview) got also some minor changes to make them more beginner-friendly.
For those quick troubleshooting sessions for a shorter period, with which you really don't want to spend too much time on setting up something temporary, we've added a flag / env. variable to start monitoring based on a standard JDBC connect string input. This works especially well for superusers as all needed "helper functions" will be then created automatically. NB! Unprivileged users might also want to add the PW2_ADHOC_CONFIG=unprivileged env. variable to below sample and also start with the according "DB overview - Unprivileged" dashboard. See here for more.
|
1 2 3 |
docker run --rm -p 3000:3000 --name pw2 -e PW2_ADHOC_CONN_STR='postgresql://pgwatch2@localhost/pgwatch2' cybertec/pgwatch2 |
NB! For the full changelog see - here.
Any feedback highly appreciated as always! Project GitHub link - here.
No central config DB strictly required anymore.
"Single command launch" based on JDBC connect string for temporary monitoring sessions.
For cases where the amount of monitored DBs grows too big for one gatherer daemon to handle or there are different criticality requirements.
The gatherer daemon can now periodically scan for new DBs on the cluster and start monitoring them automatically.
Now users can add any fixed labels / tags (e.g. env/app names) to be stored for all gathered metric points on a specific DB.
Dumps out JSON on metrics gathering progress.
Uses data only from metrics that are visible to all Postgres users who able to connect to a DB, with only "pg_stat_statements" additionally available.
Python "psutil" package + "PL/Python" required on the monitored DB host. Provides detailed CPU / Memory / Disk information with the help of according helpers / metrics.
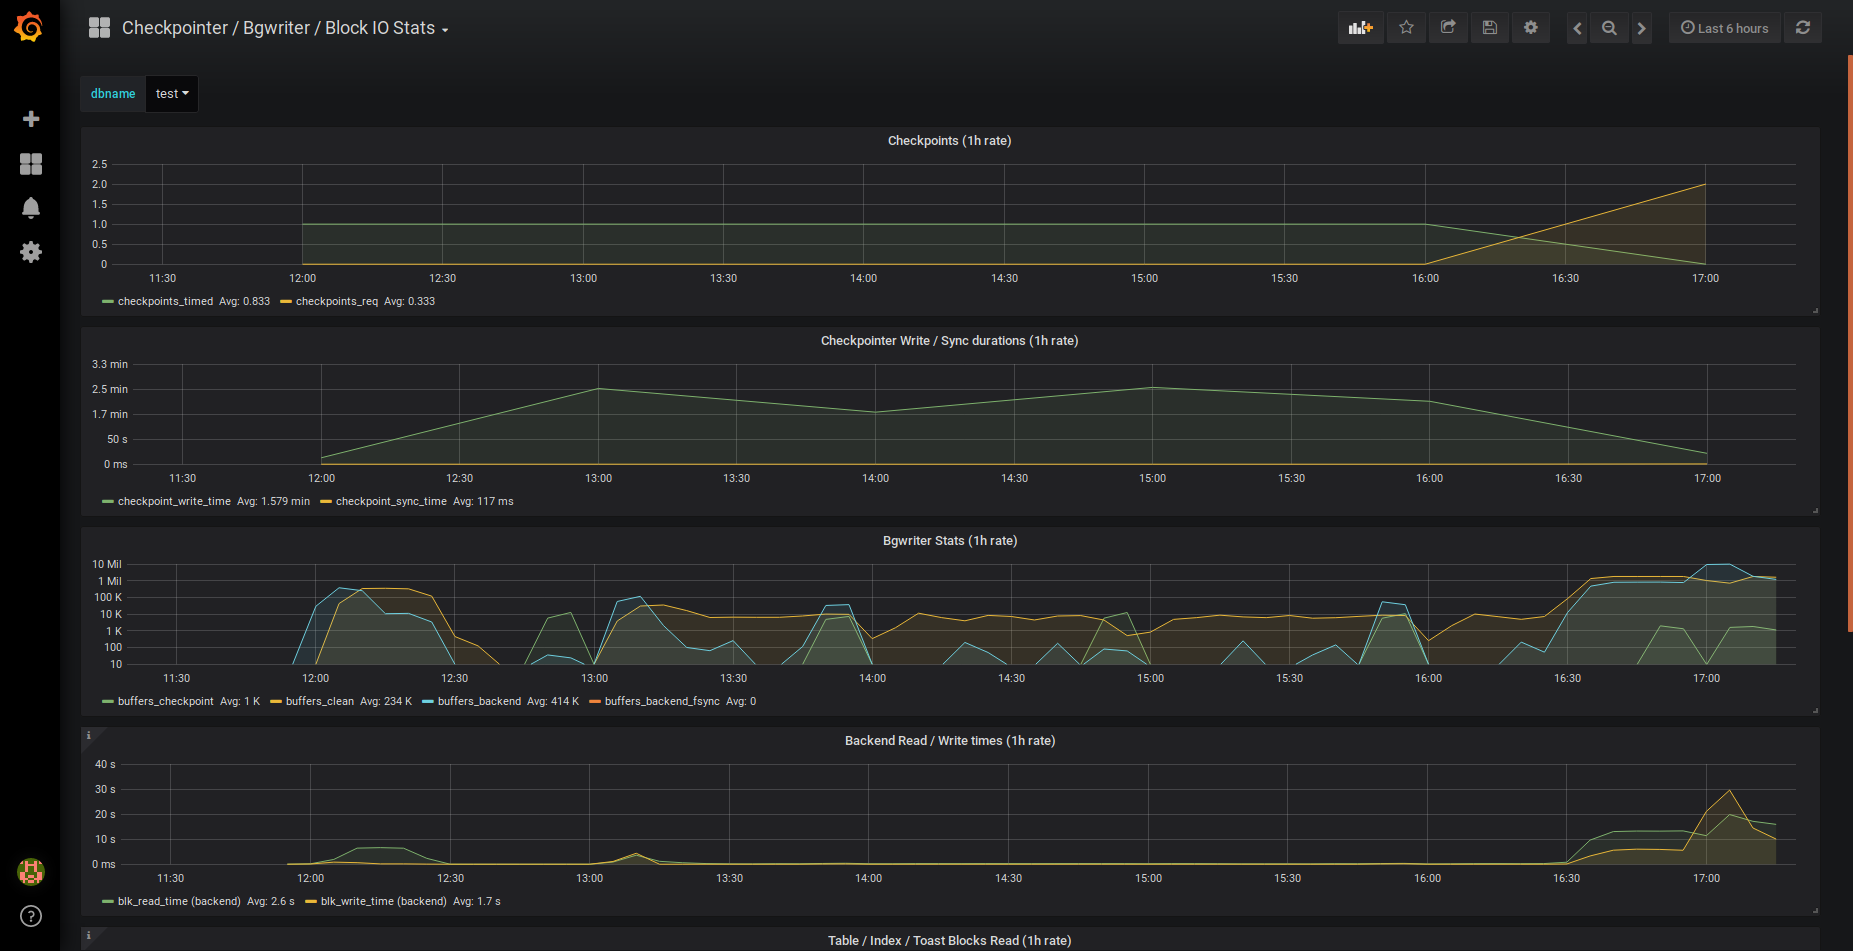
To visualize checkpoint frequencies, background writer and block IO based on Postgres internal metrics.
Big improvement for very small gathering intervals.
Improves metrics arrival lag manifold when latency to InfluxDB is considerable.
pgwatch2 is constantly being improved and new features are added. Learn more >>
Leave a Reply