By Kaarel Moppel - The last couple of weeks, I've had the chance to work on our Open Source PostgreSQL monitoring tool called pgwatch2 and implemented some stuff that was in the queue. Changes include only a couple of fixes and a lot of new features... so hell, I'm calling it "Feature Pack 3"... as we've had some bigger additions in the past. Read on for a more detailed overview on the most important new stuff.
Table of Contents
The focus word this time could be "Enterprise". Meaning - firstly trying to make pgwatch2 easier to deploy for larger companies, who maybe need to think about security or container orchestration and secondly also adding robustness. Security even got some special attention – now there's a pgwatch2 version suitable for running on OpenShift, i.e. Docker process runs under an unprivileged user. But there are also quite some new dashboards (see screenshots at the end), like the long-awaited "Top N queries", that should delight all "standard" users and also some other smaller UI improvements.
And please do let us know on GitHub if you’re still missing something in the tool or are having difficulties with something – I myself think I've lost the ability to look at the tool with beginner eyes. Thus - any feedback would be highly appreciated!
Project GitHub link – here.
Version 1.3 full changelog – here.
Suitable for example for OpenShift deployments.
Using volumes was of course also possible before, but people didn't seem to think about it, so now it's more explicit. Volumes helps a lot for long term Docker deployments as it makes updating to new image versions quite easy compared to dump/restore.
These can be used to do some advanced orchestrated setups. See the "docker" folder for details. There are also latest images available on Docker Hub, but it's meant more for DIY still.
Now it is possible to turn off anonymous access and set admin user/password.
One can now easily monitor/alert on a mix of on-prem and AWS RDS managed DBs.
Visualizes PgBouncer "SHOW STATS" commands. NB! Requires config DB schema
change for existing setups as a new "datasource type" field was introduced.
Now one can see based on pg_stat_statements info, exactly which queries are the costliest (4 criteria available) over a user selected timeperiod. Lots of people have asked for that, so please, enjoy!
Helps to visually highlight biggest tables/indexes. Uses a custom plugin for Grafana.
Metrics gathering daemon can now store all gathered metrics in 2 independent InfluxDBs...so kind of homebrewn clustering. For real clustering one needs the commercial Influx version so be sure to check it out also if needing extra robustness, seems like a great product.
Previously if Influx was down metrics were gathered and saved in daemon memory till things blew up. 100k datasets translates into ~ 2GB of RAM.
Variable is called PW2_IRETENTIONDAYS. Default is 90 days.
pgwatch2 is constantly being improved and new features are added. Learn more >>
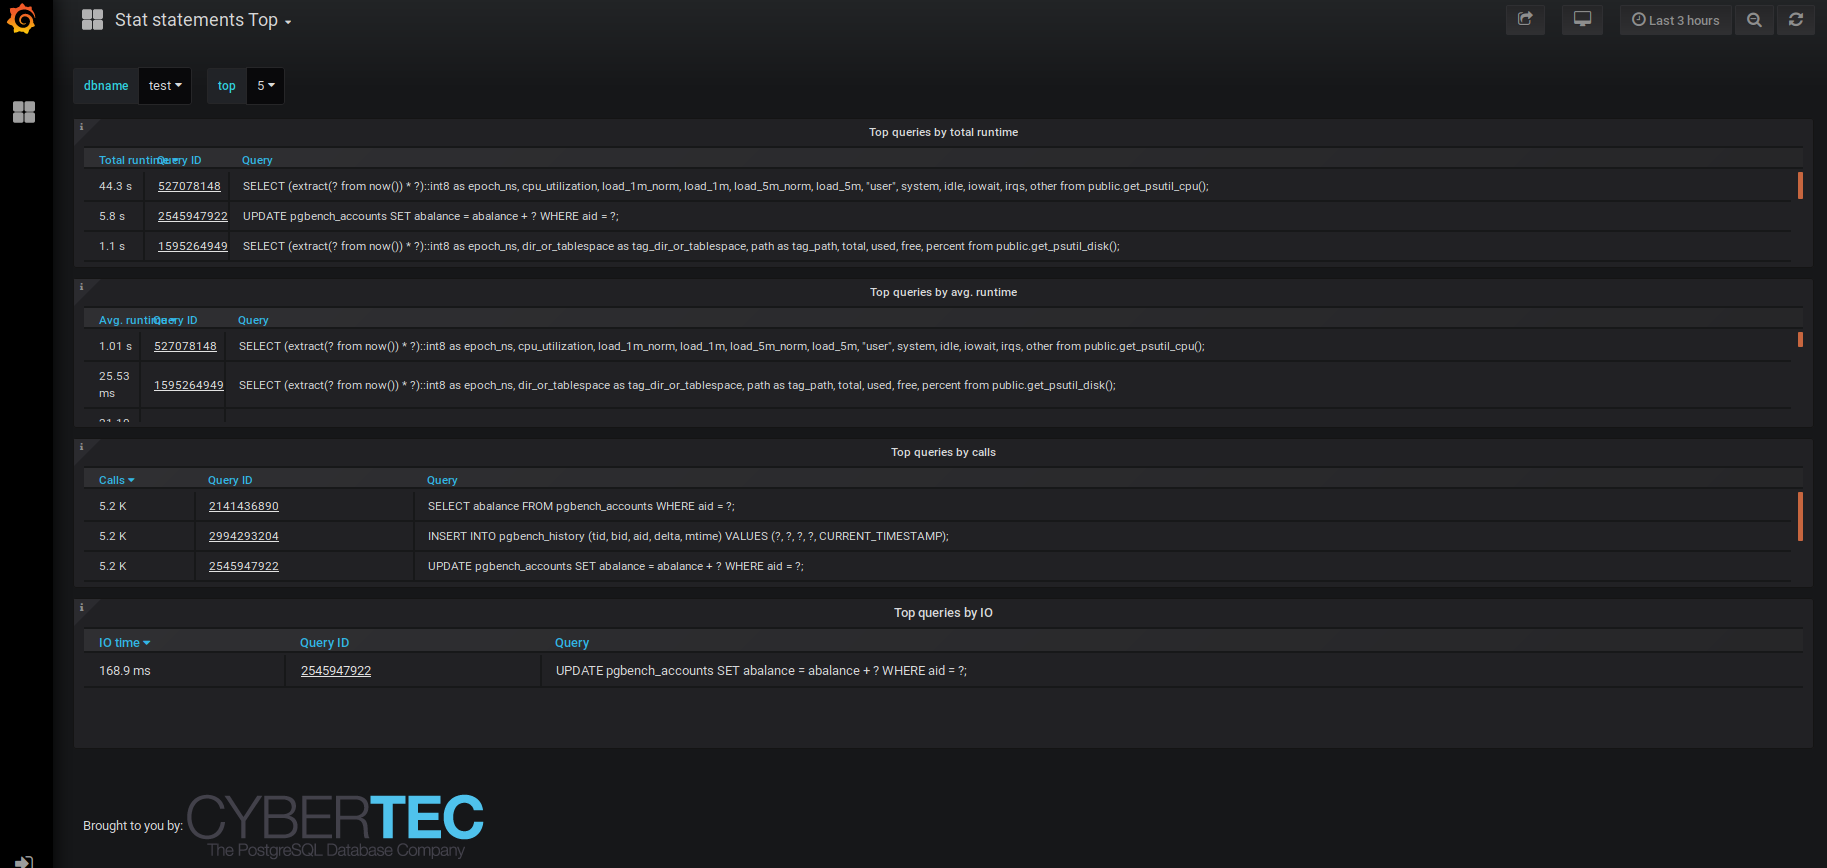
Stat Statements Top
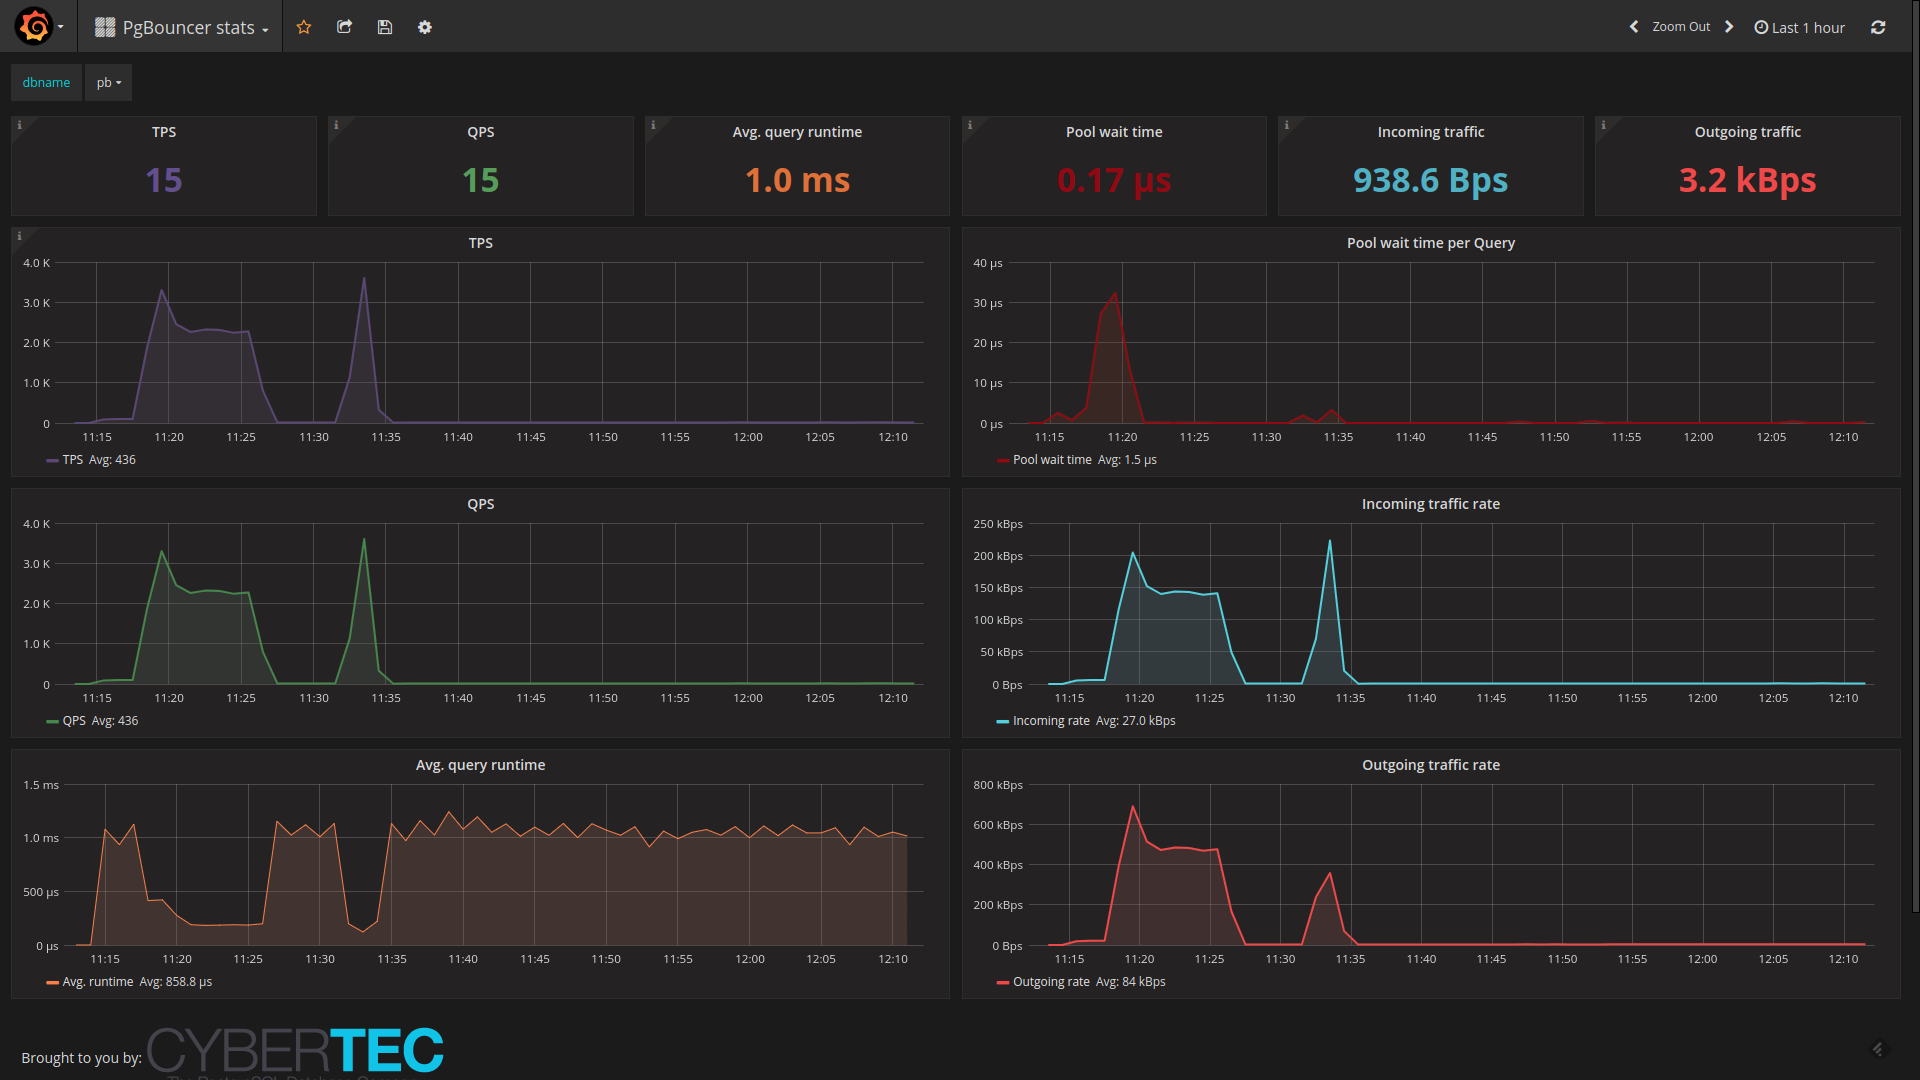
PgBouncer Stats
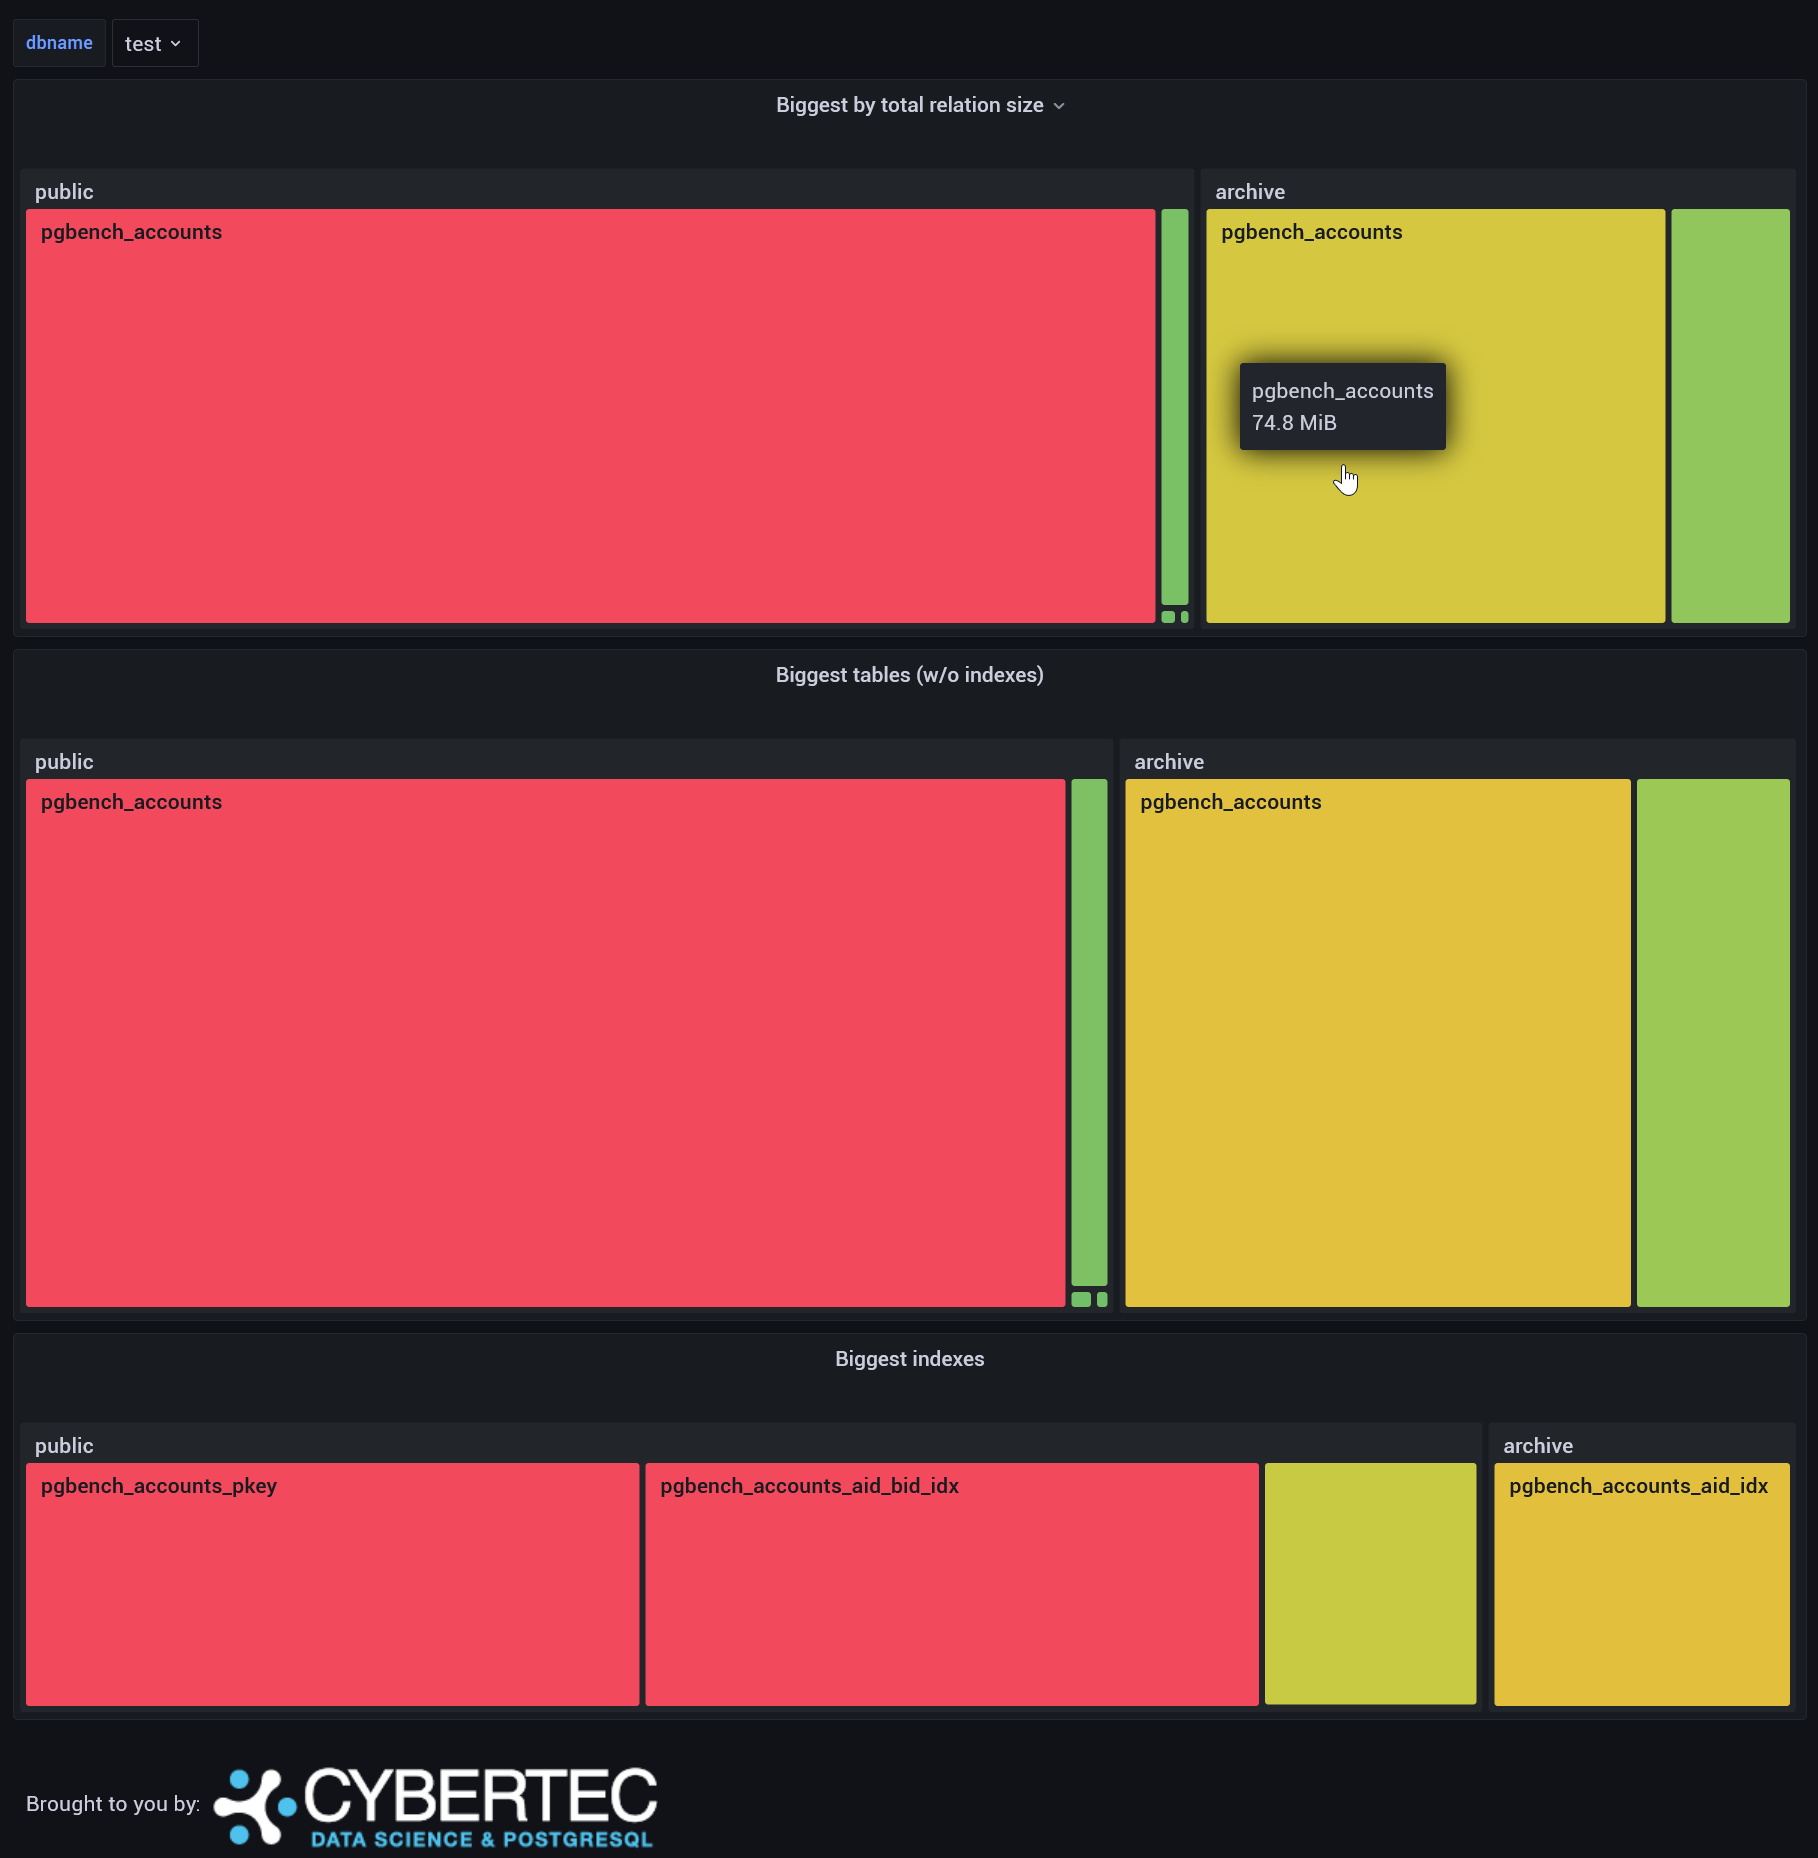
Biggest relations
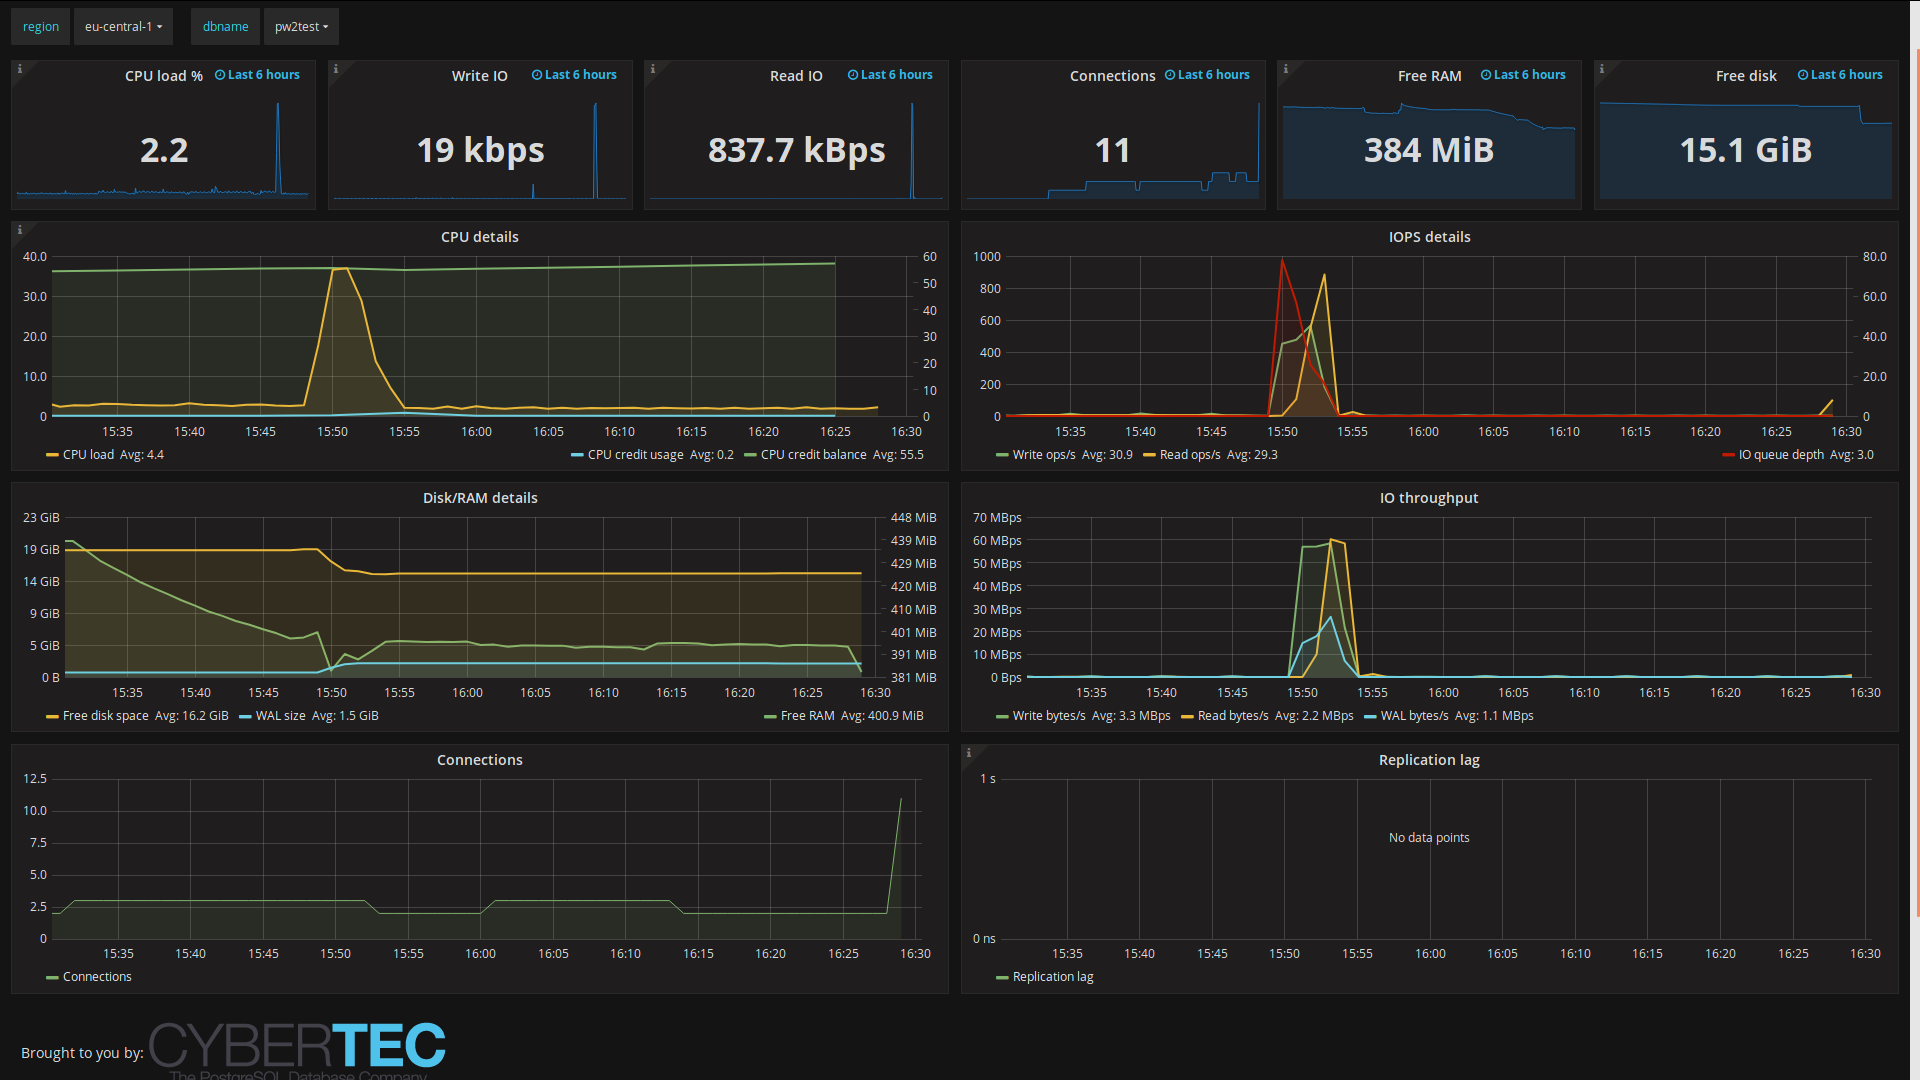
AWS RDS overview
Hi Kaarel,
As per instruction given in below url I have installed pgwatch2 on my ubuntu machine.
1. I donot get any log in http://127.0.0.1:8080/logs/%5Bpgwatch2|postgres|webui|influxdb|grafana]. What configuration I missed ?
2. I tried to attached existing JSON dashboards in grafana however it is not working.
3. Docker option is easy to set up. But while using docker I can not monitor db exists on my windows machine. It gives me error DB does not exist.
4. Can we use docker for monitoring production db ?
Could you please
suggest ? I spent one week to resolve this.
Thanks
Darshan Shah
Hi! Indeed, logs are only working out of the box for Docker setup, needs configuring otherwise. And yes, Docker version is production ready. But about the other issues please open an issue on Github with all relevant info, blog is not really meant for that:)