After exactly half a year (seems to be a pattern already) since the last major release of pgwatch2 Open Source PostgreSQL monitoring tool, I'm glad to announce that another set of useful features and improvements have found their way into the pgwatch2 code repository!
Table of Contents
The new version is incremented to v1.8.0 and content-wise, it's mostly about new features and improvements with some bugfixes thrown in - but previous versions have proven to be very stable. So here is a short list of the most significant changes since the last major release, v1.7. Note that not all changes are covered here so please go to the GitHub changelog if details are of interest to you, i.e. if you are upgrading from an existing installation.
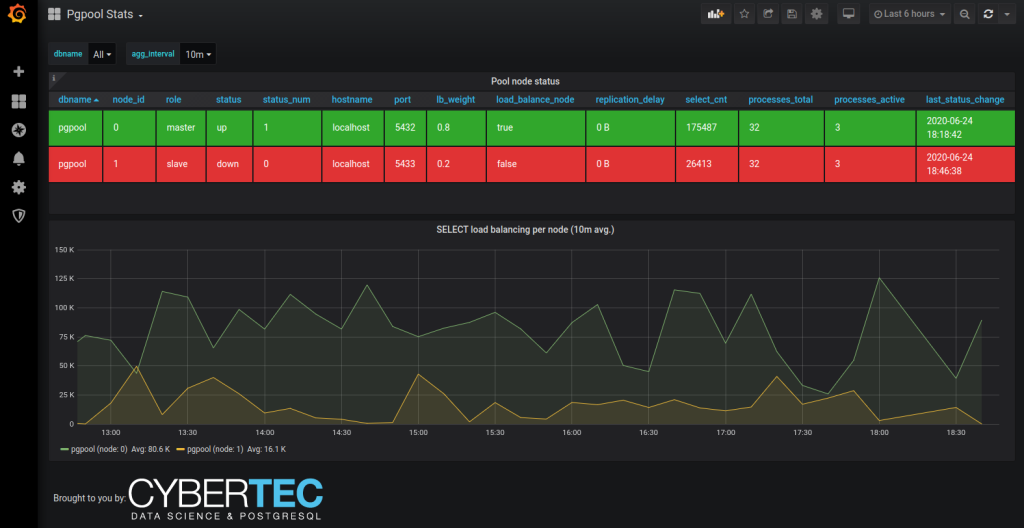
The main feature for me this time would be Pgpool support. Although I usually try to avoid using it if possible but lots of our customers still do, so that over time there have been quite some requests on that and finally it's here. From the technical side it makes use of the "SHOW POOL_NODES" and "SHOW POOL_PROCESSES" commands (being extensible via SQL still as all metrics) and glues the data together so that it's especially useful to monitor load balancing setups where Pgpool has a tendency to promptly detach nodes from load balancing even when some milder errors are encountered.
Besides the regular and obvious PostgreSQL v13 support (touching up some metrics, most notably the pg_stat_statements related ones) the second most notable feature is the addition of another option to store metrics in a PostgreSQL database (5 different storage schemas now for Postgres + InfluxDB + Prometheus + Graphite), specifically targeted support for the very popular TimescaleDB extension. Usage of this extension was, of course, already possible previously as it does not fiddle too much with the SQL access layer, but the users had to roll up the sleeves and take care of details such as registering hypertables, chunking and retention – now this is all automatic! After the initial rollout of the schema of course.
...that although it will most probably work, I do not recommend using TimescaleDB for pgwatch2 before version v1.5 as then the "killer feature" of built-in compression for historic chunks was added – before that there are no gains to be expected against standard Postgres given some pgwatch2 auto-partitioned storage schema was used. Talking about gains - according to my testing the compression really helps a lot for bigger monitoring setups and savings of 5-10x in storage space can be achieved! The query times did not really change though as the latest data that the dashboards are showing is not yet compressed and still mostly cached.
This new feature allows pausing of certain metrics collection on certain days/times, with optional time zone support if monitoring stuff across the pond for example. The main use case is that on some servers we might have very performance critical timespans and we don't want to take any chances – as indeed some bloat monitoring metrics (not enabled by default though) can cause considerable disk load.
Such metrics collection pausing can be both defined on the "metric" level, i.e. applies for all hosts using that metric during the specified interval, or on "metric-host" level so that it's really targeted. A sample declaration for one such "pausing" interval can be seen here.
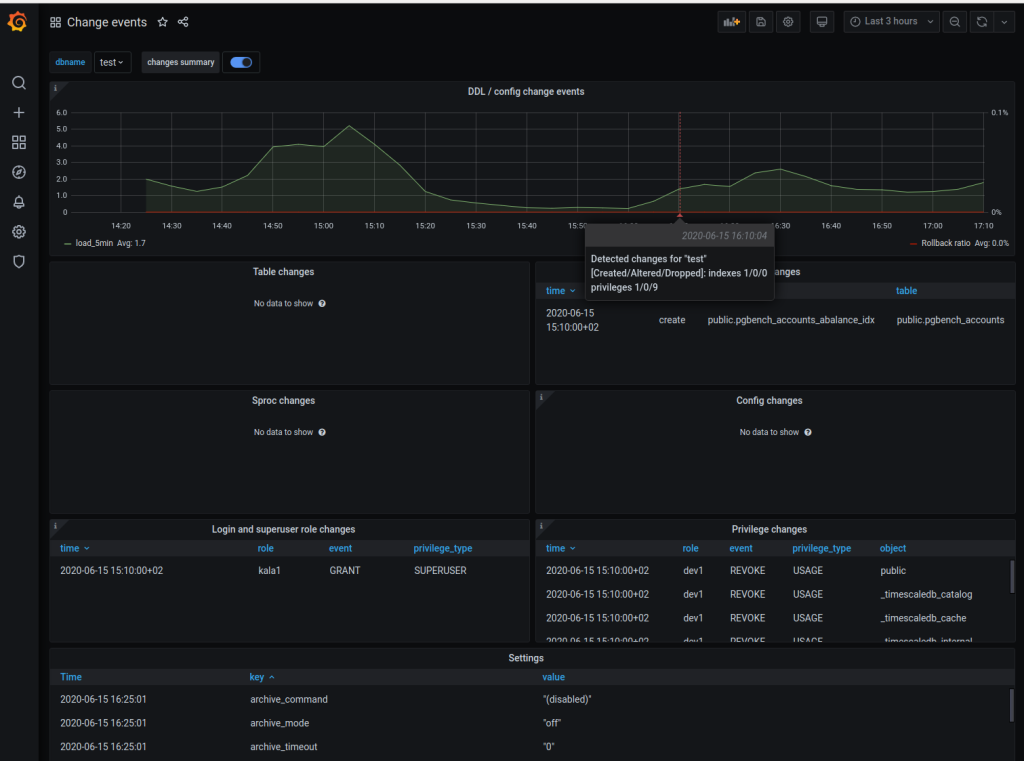
Previously already table, index, function and server configuration changes were tracked (if the "change_detection" metric was enabled) but now we also monitor object access privileges on tables / views, schemas, functions, databases and the roles system - login roles, granted role associations and most importantly Superusers. The new information is made available on a new panel on the already existing "Change events" dashboard.
This gatherer improvement aims to reduce query load in case we're monitoring many or all databases of a single instance. Previously all metrics were always fetched directly from the DB...but in reality a lot of them are global / instance level metrics (WAL, replication, CPU load, etc) and we could re-use the information. And exactly this is now happening for the 'continuous' DB types out of the box. Caching period is by default 30s, but customizable via the –instance-level-cache-max-seconds param or PW2_INSTANCE_LEVEL_CACHE_MAX_SECONDS env. variable.
So far all the configuration operations in the optional Web UI component were only possible "per monitored db" - so it was a lot tedious clicking to disable / enable all hosts temporarily or to start using some other pre-set configs. So now there bulk change buttons for enabling, disabling, password and preset config change over all defined databases.
We were already able to define metrics SQL-s based on PostgreSQL version and primary / replica state but now there's another dimension – versions of specific extensions. The use cases should be rare of course and the whole change was actually a bit unplanned and needed only because one extension we use for index recommendations changed its API so much that we needed this new dimension for a workaround in cases when both old and new versions of the extensions were used on separate DB hosts. But anyways I'm pretty sure we're going to see such breaking extension API changes also in the future so better be already prepared for the real life.
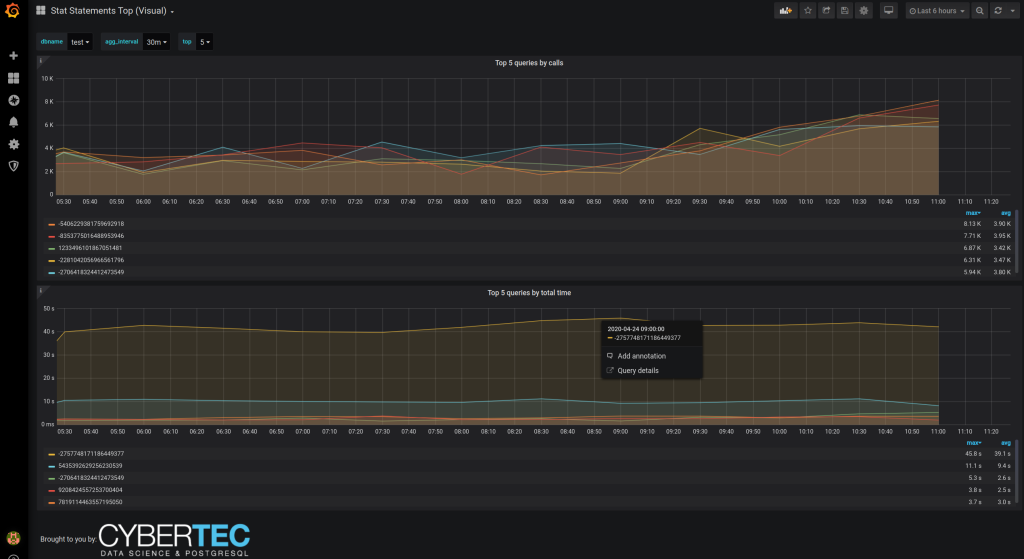
There was already a tabular dashboard for the data extracted via the pg_stat_statements but now the new 'Stat Statements Top (Visual)' shows the top resource consuming queries in graph format so it's visually easier to grasp and also shows changes over time. There are also links to the 'Single query details' dash making use of the new Grafana "data links" feature. NB! Defined only for Postgres data sources.
Another one based on pg_stat_statements data (the most useful performance troubleshooting extension certainly deserves that) – the new 'Stat statements Top (Fast)' differentiates from the standard 'Stats Statements Top' by "assuming" that the during the selected time range the internal statistics were not reset on the monitored DB nor was there a server crash. In this case we don't need to use the somewhat costly window functions but simple aggregates and this is a real perceptible win when looking at weekly or larger time spans. NB! Defined only for Postgres data sources.
The existing table_stats / table_io_stats metrics relying on pg_stat(io)_user_tables system views, were changed so that for natively partitioned tables (PG 10+) the purely virtual parent also gets one stats row, summarizing all child stats. For me this is a huge usability improvement actually for monitoring heavily partitioned tables and I wonder why Postgres doesn't do the same out of the box and leaves it to the user to write some relatively ugly recursive queries like the one here.
The "reco" engine now has 3 new checks / suggestion – against possibly forgotten disabled table triggers, against too frequent checkpoint requests (this is logged into the server log also by the way as warning) and against inefficient full indexing (seen quite often) on columns where most values are NULL actually and one could possibly benefit a lot from partial indexes, leaving out those NULL-s.
As AWS is here to stay would make sense to “play nice” with their Postgres services I guess – so now there’s a two new preset configs for that purpose. They’re unimaginatively called ‘aurora’ and ‘rds’ and leave out some metrics that AWS for some reason has decided not to expose or implement in case of Aurora.
This in short enables storing of slightly different metric definitions under one metric name. The only case for this currently is the new ‘stat_statements_no_query_text’ metric that is a more secure variation of the normal ‘stat_statements’ metric without the query texts, but not to define separate dashboards etc, the data is stored under the same name. To make use of this feature define a metric level attribute called ‘metric_storage_name’ and the metric will be routed correctly on storage.
These two tools are quite popular in the community so now there are according metrics and PL/Python metric fetching helpers to execute the “info” commands on the OS level and give back the results via SQL so that it could be dashboarded / alerted on in Grafana as for all other metrics.
As we see more and more Logical Replication usage for various application architecture goals adding a built-in metric makes a lot of sense. It’s called 'logical_subscriptions' and is included now in the 'full' preset config.
Now after RPM / DEB install and Python dependency installations (not included, needs pip install -r requirements.txt) one can immediately launch also the Web UI. There’s also a SystemD template to auto-start on boot.
And as always, please do let us know on GitHub if you’re still missing something in the tool or are experiencing difficulties - any feedback would be highly appreciated to make the product better for everyone!
Project GitHub link – here
Full changelog – here.
DEMO site here.
pgwatch2 is constantly being improved and new features are added. Learn more >>
Hello Kaarel Moppel,
I want to collect metric from MySQL database. I configured mysql database but got below error.
Could not connect to specified host (ignore if gatherer daemon runs on another host): expected authentication request from server, but received J
2020/12/29 14:13:13 ERRO main: could not start metric gathering for DB "mysqltest" due to connection problem: pq: unknown response for startup: 'J'
I tried to add data source in grafana and connect it worked. Could you please provide any hint ?
Thanks
Darshan Shah
Hi, very first lines of the README (https://github.com/cybertec-postgresql/pgwatch2#pgwatch2) point out that currently it works only with Postgres, so I'm afraid you need to look at some other tool...
Thanks Kaarel for quick response.
Yes I also thought so, but wanted to confirm with you.
isn't it row count from pg_stat_statements useful? what's the easiest way to do this?