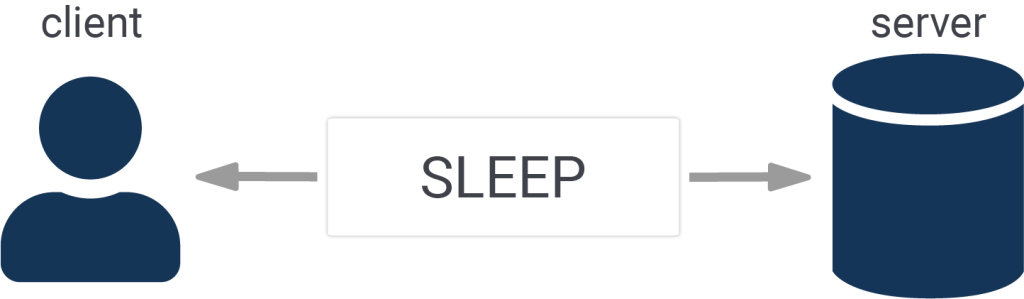
Database performance is truly important. However, when looking at performance in general people only consider the speed of SQL statements and forget the big picture. The questions now are: What is this big picture I am talking about? What is it that can make a real difference? What if not the SQL statements? More often than not the SQL part is taken care of. What people forget is latency. That is right: Network latency
Table of Contents
“tc” is a command to control network settings in the Linux kernel. It allows you to do all kinds of trickery such as adding latency, bandwidth limitations and so on. tc helps to configure the Linux kernel control groups.
To simplify configuration I decided to us a simple Python wrapper called tcconfig, which can easily be deployed using pip3:
|
1 |
[root@centos77 ~]# pip3 install tcconfig |
After downloading some Python libraries the tool is ready to use.
In the next step I want to compare the performance difference between a normal local connection and a connection which has some artificial network latency.
PostgreSQL includes a tool called pgbench which is able to provide us with a simple benchmark. In my case I am using a simple benchmark database containing just 100.000 rows:
|
1 2 3 4 5 6 7 8 9 10 11 12 13 |
hs@centos77 ~]$ createdb test [hs@centos77 ~]$ pgbench -i test dropping old tables... NOTICE: table 'pgbench_accounts' does not exist, skipping NOTICE: table 'pgbench_branches' does not exist, skipping NOTICE: table 'pgbench_history' does not exist, skipping NOTICE: table 'pgbench_tellers' does not exist, skipping creating tables... generating data... 100000 of 100000 tuples (100%) done (elapsed 0.11 s, remaining 0.00 s) vacuuming... creating primary keys... done. |
The following line fires up a benchmark simulating 10 concurrent connection for 20 seconds (read-only). This is totally sufficient to proof the point her:
|
1 2 3 4 5 6 7 8 9 10 11 12 |
[hs@centos77 ~]$ pgbench -S -c 10 -h localhost -T 20 test starting vacuum...end. transaction type: scaling factor: 1 query mode: simple number of clients: 10 number of threads: 1 duration: 20 s number of transactions actually processed: 176300 latency average = 1.135 ms tps = 8813.741733 (including connections establishing) tps = 8815.142681 (excluding connections establishing) |
As you can see my tiny virtual machine has managed to run 8813 transactions per second (TPS).
Let us see what happens when latency is added
In this example we assign 10 ms of delay to the loopback device. Here is how it works:
|
1 |
[root@centos77 ~]# tcset --device lo --delay=10 |
10 milliseconds does not feel like much. After all even the Google DNS server is 50ms “away” from my desktop computer:
|
1 2 3 4 5 |
iMac:~ hs$ ping 8.8.8.8 PING 8.8.8.8 (8.8.8.8): 56 data bytes 64 bytes from 8.8.8.8: icmp_seq=0 ttl=54 time=51.358 ms 64 bytes from 8.8.8.8: icmp_seq=1 ttl=54 time=52.628 ms 64 bytes from 8.8.8.8: icmp_seq=2 ttl=54 time=52.819 ms |
If your database is running in the cloud and 10ms of network latency are added. What can go wrong? Let's take a look and see:
|
1 2 3 4 5 6 7 8 9 10 11 12 |
[hs@centos77 ~]$ pgbench -S -c 10 -h 10.0.1.173 -T 20 test starting vacuum...end. transaction type: scaling factor: 1 query mode: simple number of clients: 10 number of threads: 1 duration: 20 s number of transactions actually processed: 9239 latency average = 21.660 ms tps = 461.687712 (including connections establishing) tps = 462.710833 (excluding connections establishing) |
Throughput has dropped 20 times. Instead of 8813 TPS we are now at 461 TPS. This is a major difference - not just a minor incident. Latency is especially painful if you want to run an OLTP application. In a data warehousing context, the situation is usually not so severe, because queries tend to run longer.
|
1 |
[root@centos77 ~]# tcset --device lo --delay=50 --overwrite |
As you can see performance is again dropping like a stone:
|
1 2 3 4 5 6 7 8 9 10 11 12 |
[hs@centos77 ~]$ pgbench -S -c 10 -h 10.0.1.173 -T 20 test starting vacuum...end. transaction type: scaling factor: 1 query mode: simple number of clients: 10 number of threads: 1 duration: 20 s number of transactions actually processed: 1780 latency average = 112.641 ms tps = 88.777612 (including connections establishing) tps = 89.689824 (excluding connections establishing) |
Performance has dropped 100 times. Even if we tune our database the situation is not going to change because time is not lost in the database server itself - it is lost while waiting on the database. In short: We have to fix “waiting”.
In real life latency is a real issue that is often underestimated. The same is true for indexing in general. If you want to learn more about indexing consider reading Laurenz Albe's post on new features in PostgreSQL 12.
Great article! One thing that'd be interesting to see is what would happen if you increase the concurrency. E.g. for the example where throughput drops 20x, what happens if you increase concurrency by the same factor?
that is not so easy. the real fun starts when transactions holding locks take longer. in this case there might not be any improvement due to concurrency. in case of read only there might very well be linear scalability. a read-write bench might even yield zero speedup when locking is a major issue (due to transactions containing UPDATE statements which cannot commit or so)
Sure ... but a lot of this can be overcome by pushing the transactional logic into the DB, e.g. with stored procedures, right?
What I'm trying to get at: It's important to show that latency can be really bad. But it's also interesting to discuss how one might deal with such a situation when improving latency isn't easily possible.
oh boy here we go again, put the business logic in the database or application tier.
Yeah, it's an issue. On the other hand, if it's 10ms away, and your queries take 1000ms, it's not so bad. Can be a good use of a hot replica where otherwise the CPU and RAM would go to waste. Just be sure to tweak the settings so queries aren't cancelled.
True. But few applications have an average query duration of 1s. All OLTP applications are affected.
Thanks again for this article.
Actually this may not be a real problem, because the time spent waiting on the network is time that can be used to work on other requests.
Yes, throughput need not suffer, except that database transaction time and lock time increases.
But there is a direct impact on response time.