Yes - yes, I’m well aware that there’s already a fair amount of PostgreSQL specific monitoring tools out there - see for example see here for a non-exhaustive listing from Postgres Wiki (but there are some more, couldn’t find PgHero). But nevertheless, I was still missing something. I think the main problem that always annoyed me was that all the tools required either too much setup and were too invasive (think about installing an extension and restarting the server) or were too inflexible - just gathering and showing information that someone thought was a good idea.
Yes, this Apple-style approach might produce visually appealing results most of the time, but it also makes your life really hard if you want to tune something or you find a bug and the tool maintainers seem to be on holidays sipping Margaritas somewhere. You’ll then end up pulling out a lot of hair because you need to quickly dive into Perl, Python, C, Java, younameit. So what could be improved? What should be the main characteristics of a ‘brave new’ type of monitoring application?
Simplest installation should be fast and non-invasive, should require no knowledge of inner workings of Postgres nor knowledge of some programming language, compiling etc. These requirements limit the options heavily, but in today’s world this mostly means relying on Docker, which already works on almost every platform. For the other platforms where Docker is not an option, it can still be installed from the sources, but users need to take some more steps then.
GitHub link here. Community help very much appreciated!
Pgwatch2 doesn’t require any modifications to the database server for main functionality, acting as a remote agent, executing normal queries over the network to read metrics and stores the results that are later used for graphing.
People will want to use your program for cases which you even couldn’t have imagined, inventing new metrics as they go. Braking changes will someday find their way into core Postgres. And then you want to be able to go in an spend maybe 10 minutes to customize the new/changed metric and be done. In our case this means sticking to good old SQL for defining metrics. It has the big upside that everyone working with databases can more or less grok it.
As life has shown recently on many levels, it all comes down to data. If it’s easily accessible everyone can build on it from there. So in pgwatch2 context this means betting on one of the most popular Time Series Databases around – InfluxDB. Written in Go, it offers great performance, very good data compression and easy data discovery - true after learning another SQL-like query language called InfluxQL. But luckily to use pgwatch2 you don’t really need to care about it, only when you want to implement something on top of the metrics data yourself.
I have first-hand experience from maintaining the also quite popular and nice Postgres monitoring solution PgObserver - that building nice UI-s on metrics is hard, really hard. Especially for database/backend developers. All the countless Javascript frameworks, multitude of devices, etc. So for pgwatch2 we decided to leave it to professionals and stick to the best dashboarding (free graphing) solution out there – Grafana. This means that we’ll only provide some predefined dashboards (and data of course) and users can easily and intuitively compile exactly graphs/tables/counters the way they like to see them. Less work for us – great! We’ll also provide a thin administrative web UI but with the main goal of managing databases and metrics that should be monitored.
“Installing” pgwatch2 in its default all-included form, which should satisfy most of users, couldn’t be much simpler. Given of course that you have previously installed Docker on the machine meant to act as the monitoring server:
|
1 2 3 |
# start the latest docker image in the background docker run -d -p 3000:3000 -p 8080:8080 --name pw2 cybertec/pgwatch2 |
After that you can wait a minute for Docker to initialize and then you can already start inspecting metric graphs using predefined dashboards via Grafana on port 3000. If you can’t try it out currently please take a look at the screenshots above.
This is how the default DB overview page should look like:
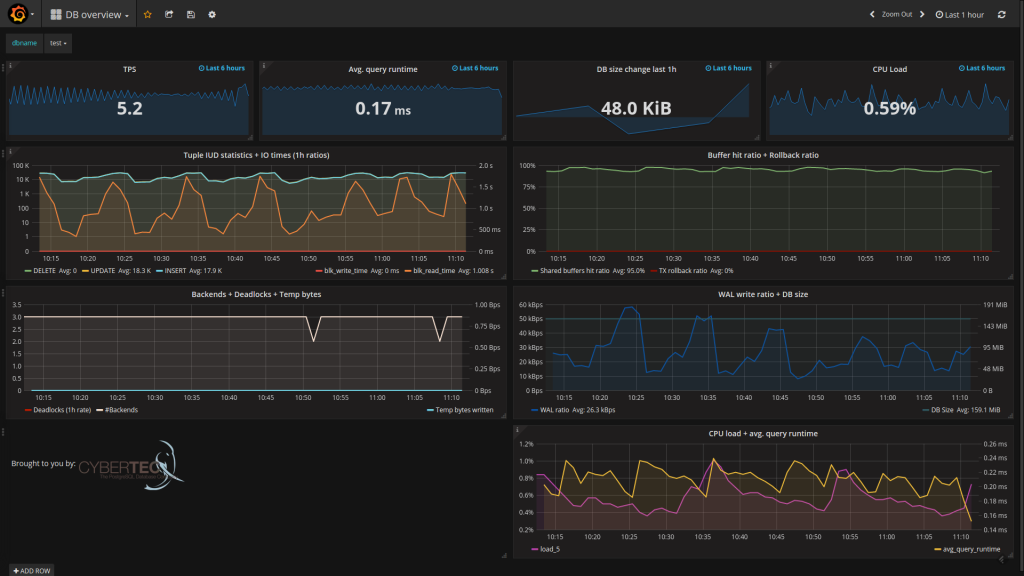
Next step after starting the Docker image would be of course starting to monitor metrics from your own PostgreSQL database. For that you need to add the connection string of your “database under monitoring” to pgwatch2, so that internally a new statistics fetching process could be started. For that there’s a small Web UI on port 8080 (by default no authentication). Through the UI (see screenshots above) you can configure the connection details (host, port, user, password) following the example of an already existing entry that is actually the pgwatch2 configuration database running inside Docker. After 5 minutes you should already be able to see graphs for your own database.
NB! Make sure your monitored database server is accessible from inside Docker (possible problems with pg_hba.conf rules) and user/role used for monitoring is allowed to query pg_stat_* statistic views (allowed by default even for non-superusers). When things still don’t seem to function you may want to check the logs which are available from the Web UI, “docker logs” can’t currently help too much here as it provides logs for the management process only. Also note that the default data retention period for metrics is 3 months! It can be easily extended though with an InfluxDB administrative command.
Out of the box gathering and storing of almost all metrics provided by Postgres Statistics Collector subsystem (pg_stat_* views) is possible. Users just need to enable the accordingly named metrics per database as mostly it doesn’t make sense to monitor flat out everything. To enable choosing the right amount of monitoring details there are some predefined monitoring configurations available (e.g. named descriptively “basic”, “exhaustive”) and user can peek into their definitions and choose an appropriate one or create their own configurations consisting of metric names and monitoring intervals in seconds, represented as JSON. A list of available metrics together with some instructions is visible also on the Grafana "Documentation" dashboard.
A “metric” in this context means a named SQL query that returns some columns with values – text, integers and floating point numbers are supported, and you can (and should) create your own metrics as it is very easy. Just add the query selecting something from the statistics views (or even normal tables i.e. you can do business process monitoring!) via the UI, just making sure the query executes fast (5s timeout currently) and additionally all metric queries should also return an “epoch_ns” column (seconds since the Unix epoch in nanoseconds, but this you can copy from existing metrics) to record the exact time of the metrics snapshot. Columns can optionally also be “tagged” or “indexed” in the storage backend (InfluxDB) by prefixing the column names with “tag_” - for such columns Grafana will also provide nice data discovery features and queries will be faster on them also.
When talking about dashboard here we mean Grafana dashboards, that are basically a set of graphs/counters/tables on a single page, giving you an overview over something, all depending on the data you have. Most importantly - you can quickly visually compose dashboards yourself by just clicking around! Everything is pretty self-descriptive, you’ll be provided a list of available databases and metrics etc, but it will still take about an hour of trying and reading to really master it - but the investment will pay itself off many times. Note that for creating your own dashboard you should log into Grafana as “admin”! Default password can be found from the README and after logging in you can also tune any other settings and create new users.
From our side there are currently 5 predefined dashboards provided:
There are of course some more internal details to this solution (the metrics gathering daemon implementation, the configuration DB, metric fetching helpers for reading the CPU load and pg_stat_statement data, alerting possibility, security aspects, etc) and some questions might be left unanswered but this you can look up from the source code or from the README, and I do also plan to write another blogpost on the details soon.
But right now the most import thing for us would be to get some initial feedback from you - what do you think about the described approach? What do you like and what could be improved in your opinion? It’s also a very new software of course so please report all strange sightings. Thanks a lot!
pgwatch2 is constantly being improved and new features are added.
The title has got a question mark for a reason this time, since using ARM architecture could mean a lot of things, varying from super-low-power milliwatt range Arduinos to Raspberry Pis, ending with specialized supercomputing clusters. The common denominator here is still efficiency. ARM architecture is designed to be very efficient and to save money on TCO in the end, compared to traditional servers. From the reliability point-of-view, there is no problem at all. I know I could sleep peacefully even when running my pet project’s database on a Raspberry Pi (given there is a backup). But what about performance? Could Postgres-on-ARM be a viable option for more demanding projects where performance still matters a bit? The fuzzy answer - yes it can well be. First, allow me to introduce the M2DC project.
During a recent conference, we came into contact with people working on an interesting hardware project called M2DC - the Modular Microserver Data Centre.
In short, the project is a joint effort of many companies (supported by the European Union!). It is centered on building modular and scalable ARM-based general purpose server clusters that will reduce the TCO of servers by 50% in comparison to traditional approaches. Please read more about the project and participating companies here.
Now you may ask, "How does PostgreSQL come into play?" Well, PostgreSQL is one of the few RDBMS's that runs nicely on ARM architecture! And since the hardware specs looked intriguing (a cluster built on 4-core 2.2GHz Tegra modules), we were eager to see what it means in the real life.
After getting access to a demo system and testing the Postgres basics on it, we thought we’d document the process and the results in a nice PDF format for easier digestion. So if you'd like to actually get all the details and pictures of the hardware, as well as get a better idea of what we’re talking about and what was tested plus see the numerical results, please see the PDF below.
As for a conclusion – it's difficult as always, especially since the cluster is at its best when it comes to specialized applications (I compared it against a mainstream Amazon AWS instance). We had to leave out write tests due to slow disks. In the end, I was still surprised by the Bang-for-Buck (Performance-per-Watt) ratio. The ARM approach could pay off big-time monetarily, for example for data acquiring tasks that don’t require too many parallel database operations on a single cluster node.
But as I said, more info here:
In order to receive regular updates on important changes in PostgreSQL, subscribe to our newsletter, or follow us on Twitter, Facebook, or LinkedIn.
While reviewing my notes on some handy Postgres tricks and nasty gotchas, to conclude an on-site training course, my “current me” again learned some tricks which an older version of “me” had luckily written down. So here are two simple tricks that hopefully even a lot of Postgres power-users find surprising.
99.9% of time Postgres does a perfectly good job at figuring out which execution plan it should use to resolve all the JOINs in your multi-table/subquery query. This means that the actual order of tables listed in your query does not matter at all – Postgres will use the optimal strategy, with the goal of avoiding too many intermediate rows, use indexes, leaving out CROSS JOINS when possible, etc. But what a lot of people don’t know about is that for those 0.1% of problem cases where Postgres really doesn’t choose the optimal path, you can actually force the planner to perform the JOINs in the order they appear in your query! And it’s as easy as setting the join_collapse_limit parameter to “1”. It is an user-level setting meaning even non-superusers can set it and it also works also with older 9.X versions of Postgres. One could maybe complain a bit about the non-descriptive parameter name but all in all, great trick.
Here is an example query to illustrate the usage - solving the problem of finding tables without any indexes at all:
|
1 2 3 4 5 |
EXPLAIN ANALYZE SELECT n.nspname||'.'||c.relname FROM pg_class c JOIN pg_namespace n ON n.oid = c.relnamespace LEFT JOIN pg_index i ON i.indrelid = c.oid WHERE i.indrelid IS NULL AND c.relkind = 'r'; SET join_collapse_limit = 1; EXPLAIN ANALYZE SELECT n.nspname||'.'||c.relname FROM pg_class c JOIN pg_namespace n ON n.oid = c.relnamespace LEFT JOIN pg_index i ON i.indrelid = c.oid WHERE i.indrelid IS NULL AND c.relkind = 'r'; |
Inspecting outputted plans (plan 1 here, plan 2 here) what will we see? Indeed, for the first query the join order is: (pg_class = pg_index) = pg_namespace, but after changing the join_collapse_limit=1 our “forced” JOIN ordering is as seen from the query text: (pg_class = pg_namespace) = pg_index.
In this sample use case of course Postgres is right, and the default plan was actually better as it executed faster.
Some pun intended...but that aside, let’s think about Postgres LIKEs a.k.a. simple text search using wildcards. So let’s imagine a not too uncommon case, where we have some kind of information encoded into product codes (years, manufacturing location, ...) and then we want to find products matching some of certain criteria. Normally you would then (given there is no separate column/index with that information and no Fulltext Search setup) do something like:
|
1 |
SELECT product_cost FROM t_test WHERE product_code LIKE '%-678-%'; |
Now you may ask "What is wrong with that?" Well on its own yes, nothing…. but what about when we need to search for 5 product conditions at once? The query will get just kind of ugly and unwieldy!
|
1 2 3 4 5 6 7 8 9 10 11 |
SELECT sum(product_cost) FROM t_test WHERE product_code LIKE '%123%' OR product_code LIKE '%234%' OR product_code LIKE '%345%' OR product_code LIKE '%456%' OR product_code LIKE '%567%'; |
This is not something I normally enjoy writing...so can we do better? Yes, we can! Say hello to our “array of LIKEs”:
|
1 2 3 4 5 6 7 |
SELECT sum(product_cost) FROM t_test WHERE product_code LIKE ANY( array['%123%', '%234%', '%345%', '%456%', '%567%']); -- or the same using shorter Postgres array notation SELECT sum(product_cost) FROM t_test WHERE product_code LIKE ANY(‘{%123%,%234%,%345%,%456%,%567%}’); |
Much better, my eyes can rest now.
And though Christmas time is over, there’s an additional present with the latter notation - it is according to my tries ~10% faster! Win and win.
A side warning – such double-wildcard usage will always result in a full table scan (even when you have an ordinary index on that text column) and be potentially very slow unless you have declared a special trigram GiST index for example.
Do you know any other cool tricks? Post a comment! And continue enjoying Postgres in 2017.
In order to receive regular updates on important changes in PostgreSQL, subscribe to our newsletter, or follow us on Twitter, Facebook, or LinkedIn.
UPDATED September 2023: Most people who use PostgreSQL database systems are aware of the fact that the database engine must send changes to the so-called “Write Ahead Log” (= WAL) to ensure that in case of a crash, the database will be able to recover to a consistent state safely and reliably. However, not everybody knows that tuning the database server will actually have an impact on the amount of WAL which Postgres writes to disk. This is due to Postgres' use of checkpoints.
PostgreSQL must write changes to the WAL (or xlog as some call it) before those changes even make it to the underlying data files. In most cases PostgreSQL will simply log what has to be changed in the data files. However, it must write much much more.
To ensure that the WAL will not grow infinitely, PostgreSQL creates checkpoints. These are a perfect opportunity to recycle WAL. The size of your transaction should be more or less constant, so cleaning up WAL from time to time is an absolute must. Fortunately checkpointing is done automatically.
By default, PostgreSQL uses the following parameters to determine when a checkpoint is supposed to happen:
# checkpoint_timeout = 5min # range 30s-1h
# max_wal_size = 1GB
# min_wal_size = 80MB
These default settings are somewhat ok for a reasonable small database. However, for a big system, having fewer checkpoints will help to increase performance. Setting max_wal_size to, say, 20GB is definitely a good thing to do if your system is reasonably large and heavily loaded (writes).
What is widely known is that the distance between two checkpoints does not only improve speed due to reduced checkpointing – fewer checkpoints will also have an impact on the amount of transaction log written.
Increasing the distance between checkpoints leads to less WAL - but why does that actually happen? Remember: The whole point of having the transaction log in the first place, is to ensure that the system will always survive a crash. Applying these changes in the WAL to the data files will fix the data files and recover the system at startup. To do that safely, PostgreSQL cannot simply log the changes made to a block – in case a block is changed for THE FIRST TIME after a checkpoint, the entire page has to be sent to the WAL. All subsequent changes can be incremental. The point now is: If checkpoints are close together there are many “first times” and full pages have to be written to the WAL quite frequently. However, if checkpoints are far apart the number of full page writes will drop dramatically leading to a lot less WAL.
On heavily loaded systems we are not talking about peanuts – the difference can be quite significant.
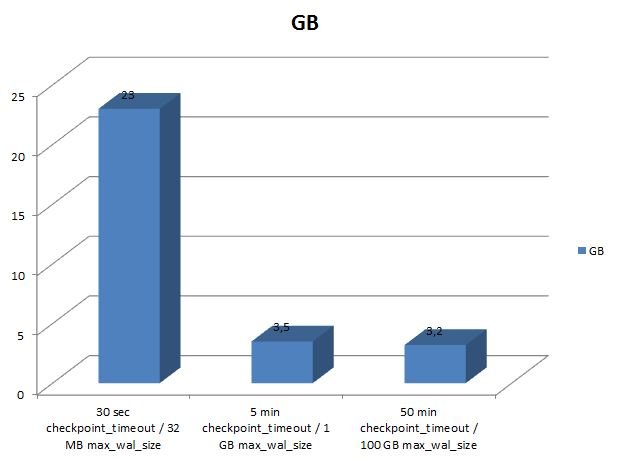
To measure how much transaction log the system actually produces during a normal benchmark, I have conducted a simple test using empty database instances:
|
1 2 3 4 |
[hs@linuxpc db]$ createdb test [hs@linuxpc db]$ psql test psql (9.6.1) Type 'help' for help. |
To reduce the number of disk flushes and to give my SSD a long and prosperous life, I set synchronous_commit to off:
|
1 2 |
test=# ALTER DATABASE test SET synchronous_commit TO off; ALTER DATABASE |
|
1 2 3 4 5 6 7 8 9 10 |
[hs@linuxpc db]$ pgbench -i test NOTICE: table 'pgbench_history' does not exist, skipping NOTICE: table 'pgbench_tellers' does not exist, skipping NOTICE: table 'pgbench_accounts' does not exist, skipping NOTICE: table 'pgbench_branches' does not exist, skipping creating tables... 100000 of 100000 tuples (100%) done (elapsed 0.09 s, remaining 0.00 s) vacuum... set primary keys... done. |
100.000 rows are absolutely enough to conduct this simple test.
Then 4 concurrent connections will perform 2 million transactions each.
|
1 2 3 4 5 6 7 8 9 10 11 12 13 14 15 16 |
[hs@linuxpc db]$ time pgbench -c 4 -t 2000000 test starting vacuum...end. transaction type: <builtin: TPC-B (sort of)> scaling factor: 1 query mode: simple number of clients: 4 number of threads: 1 number of transactions per client: 2000000 number of transactions actually processed: 8000000/8000000 latency average = 0.558 ms tps = 7173.597623 (including connections establishing) tps = 7173.616874 (excluding connections establishing) real 18m35.222s user 2m23.980s sys 3m4.830s |
|
1 2 3 4 5 |
test=# SELECT pg_size_pretty(pg_current_xlog_location() - '0/00000000'::pg_lsn); pg_size_pretty ---------------- 3447 MB (1 row) |
However, what happens if the checkpoint distances are decreased dramatically?
|
1 2 3 |
checkpoint_timeout = 30s max_wal_size = 32MB min_wal_size = 32MB |
The amount of WAL will skyrocket because checkpoints are so close that most changes will be a “first change” made to a block. Using these parameters, the WAL will skyrocket to staggering 23 GB. As you can see the amount of WAL can easily multiply if those settings are not ideal.
Increasing the distance between checkpoints will certainly speed things up and have a positive impact on the WAL volume:
In case you need any assistance, please feel free to contact us.
In order to receive regular updates on important changes in PostgreSQL, subscribe to our newsletter, or follow us on Twitter, Facebook, or LinkedIn.
+43 (0) 2622 93022-0
office@cybertec.at