After almost half a year since last updates I'm glad to announce that another set of useful features and improvements have found their way to pgwatch2 - our Open Source PostgreSQL monitoring tool of choice. New version is incremented to 1.6 but continuing the naming tradition I'm also calling it "Feature Pack 5" as it's mostly a feature release (with a couple of bugfixes as well). So here is a quick overview on changes in v1.6 – for the "full monty" and when updating from a previous version, please turn to the GitHub changelog link below.
The choice of data storage "backends" has been widened again (previous version added PostgreSQL) – it's now possible to leverage the very popular Prometheus TSDB to store metrics gathered by pgwatch2! But a recommendation - I'd use Prometheus only when it's already running in your organization and would strongly consider the alternatives (Postgres, InfluxDB) if planning to only monitor Postgres and starting a fresh monitoring setup as Prometheus is not able to store string values which is not optimal for Postgres monitoring. Also remember that we're talking about the "pull" model now – previously metrics were pushed to the datastore. To get quickly started there's also a suitable "predefined config" provided and an "DB Overview" dashboard similar to Postgres / InfluxDB.
The second big feature add support for our favourite Postgres HA cluster manager – Patroni, and should especially appeal to people running Postgres in a "cloudy" manner. In short the feature means that you can provide connection information to your Distributed Consensus Store (etcd, Zookeeper, Consul) that's powering Patroni and then pgwatch2 will periodically consult this DCS and fetch the active "to be monitored" instances listing from there. Remember - the standard way is to exactly tell on which IP-s / hostnames your Postgres instances are available. For the time being though to keep it simple access is only possible to DCS-s that are not using passwords (which is the common case as no real secrets are stored there).
And as always, please do let us know on Github if you’re still missing something in the tool or are experiencing difficulties - any feedback would be highly appreciated!
Project GitHub link – here.
Full changelog – here.
Due to quite some requests we decided to also support one of the most popular metrics gathering solutions – Prometheus. When --datastore=prometheus then pgwatch2 doesn't do any interval-based fetching but listens on port 9187 (changeable) for scrape requests configured and performed on Prometheus side. Returned metrics belong to "pgwatch2" namespace (a prefix basically) and is changeable via the --prometheus-namespace flag. Also, important to note – in this mode the pgwatch2 agent should be now run on all individual DB hosts, not centrally. While technically possible though would counter the core idea of Prometheus and would make scrapes also longer, risking timeouts. FYI – the functionality has overlap with the existing "postgres_exporter" project but also provides more flexibility in metrics configuration and all changes are "online".
pgwatch2 can automatically track and monitor all members of a HA cluster via a DCS connect string. Use the new "Host config" column to provide the DCS info according to help texts when using the Web UI or "host_config" map when using YAML. To track a single DB on all cluster members set "DB type" to " patroni" and to track all DB-s use "patroni-continuous-discovery".
Previously all declared hosts in "enabled" state were monitored but now if we're now only interested in the active master / primary then some storage / network bytes can be saved, and switchover detection will be automatic.
Powered by "goreleaser". Releases will now have DEB / RPM packages of the "gatherer daemon" + needed config / SQL files available on GitHub releases page.
This was an oversight and makes life a lot easier.
Previously one had to have all pieces (host, port, etc...) as separate fields.
Not all but most important settings are tracked when the "settings" metric is activated. Visualized on the "Change events" dashboard.
This enables cluster level summarization of all DB-based metrics. See --add-system-identifier / system-identifier-field params. PG 10+ only due to pg_control_system() requirement.
Previously one had to change all metrics for that. Feature is useful for plain informational purposes or for advanced (corporate) use cases when wanting to "join" metrics gathered by some other monitoring system that works with real database names. See --add-real-dbname / real-dbname-field params.
For most out-of-the-box dashboards it doesn't change much besides a bit shinier visuals, but this means that old v5 dashboards won't get any more updates!
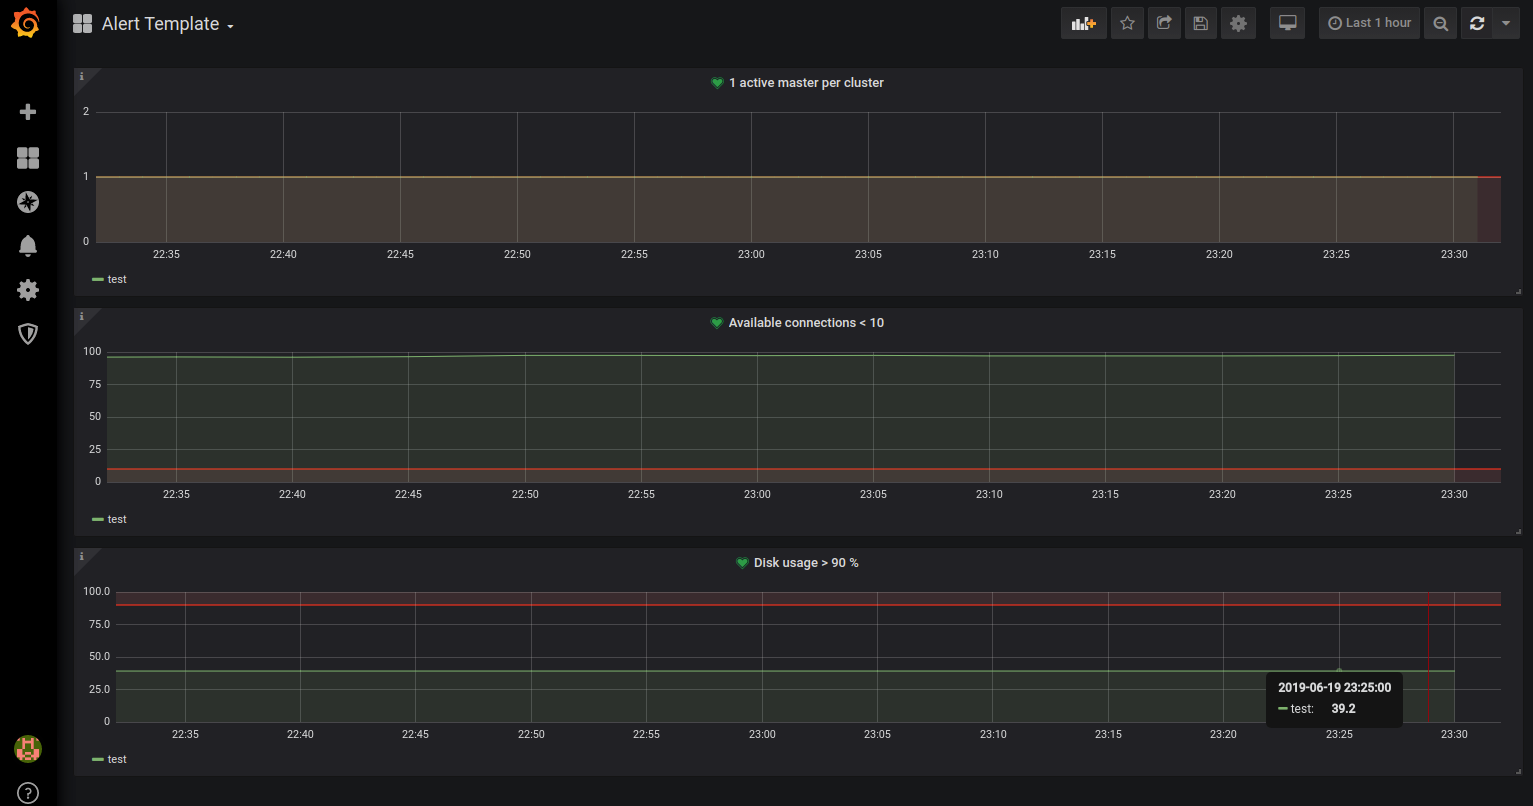
As there have been quite some questions on alerting (which is out of scope basically though), we've added something that people could take a look at and go from there. Postgres backend only.
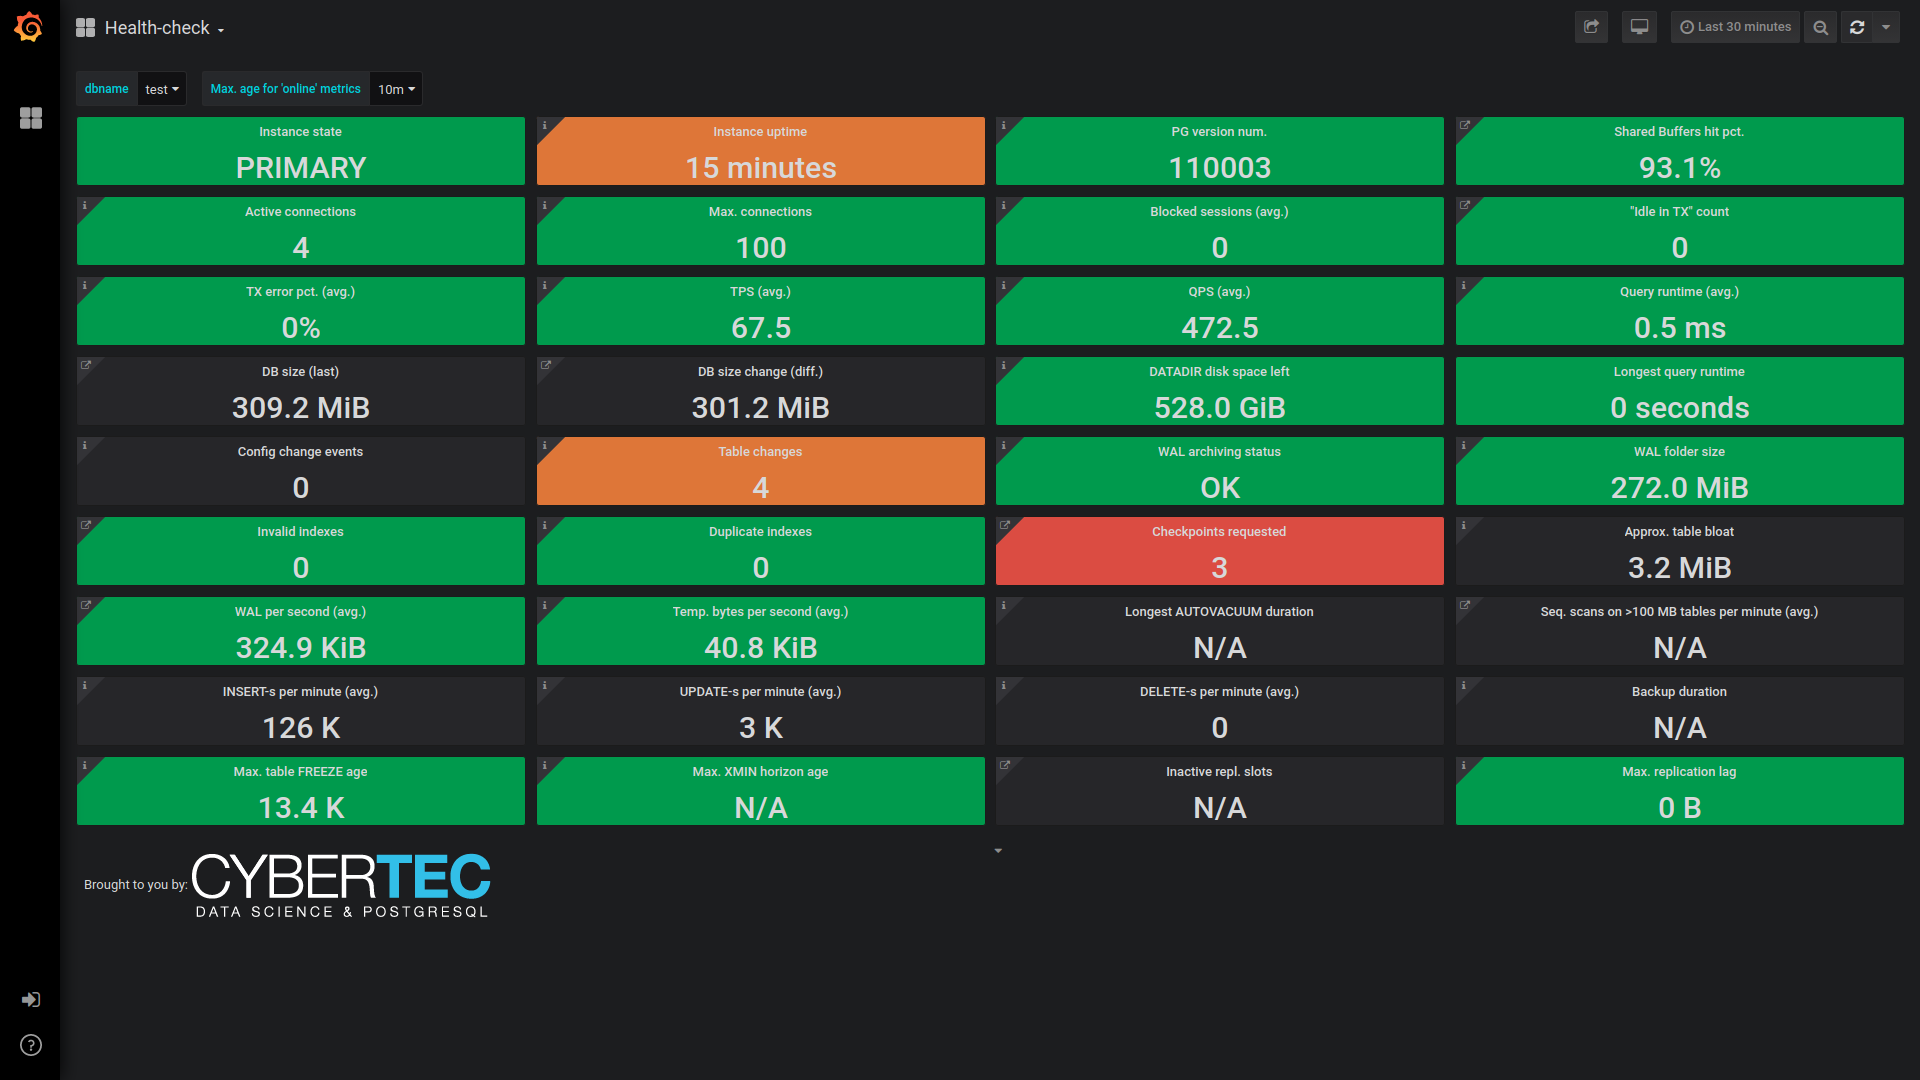
Most changes went to "Health-check" – now showing more info: PG version, uptime, transaction wraparound, longest autovacuum. "Change events" dash now also displays "server restarted / crashed" event annotations. Many other minor dashboard adjustments.
pgwatch2 is constantly being improved and new features are added. Learn more >>
Screenshot of the updated "Health check" dashboard in pgwatch2 v1.6
Screenshot of the new "Alert template" dashboard
If cluster encryption is enabled, PostgreSQL encrypts data (both relations and write-ahead log) when writing to disk, and decrypts it when reading. The encryption is transparent, so the applications see no difference between the encrypted and unencrypted clusters.
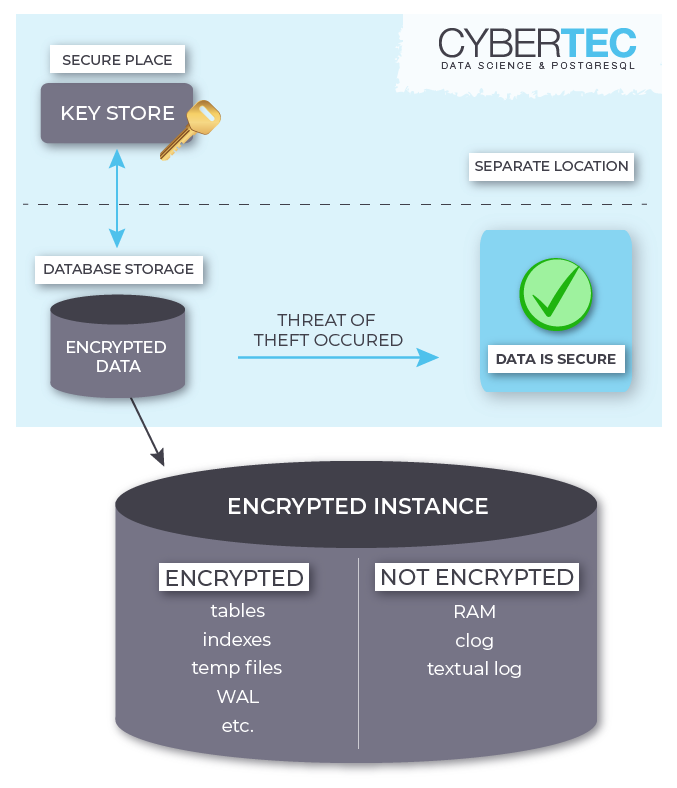
In this blog, we go through the basic steps used to install PostgreSQL 9.6 with Transparent Data Encryption (TDE) on Ubuntu. You can download the patch for this here.
sudo mkdir -p /usr/local/pgsql/data

sudo chown postgres:postgres /usr/local/pgsql/data
sudo apt-get install libreadline8 libreadline-dev zlibc zlib1g-dev bison flex libssl-dev openssl
You can choose where all files will be installed by passing --prefix. Default is /usr/local/pgsql which I am using here for example. Make sure you enable openssl by passing --with-openssl:
sudo ./configure --prefix=/usr/local/pgsql --with-openssl

sudo make
sudo make install
postgres user:
sudo su - postgres
export PATH=$PATH:/usr/local/pgsql/bin
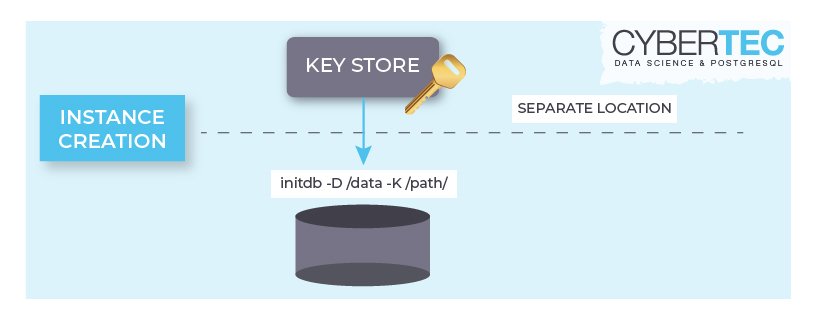
initdb -D /usr/local/pgsql/data -K/usr/local/pgsql/keypass
/usr/local/pgsql/keypass is an executable file that returns either encryption key or encryption password with the appropriate prefix. In this case, we are passing the encryption_password in 8-16 characters in a simple executable file which outputs:
encryption_password=<8-16_passphrase>
$ chmod 755 /usr/local/pgsql/keypass

$ cat /usr/local/pgsql/keypass

echo encryption_password=UrOs2k11CHiGo
Internally, PostgreSQL always uses the encryption key. If the encryption key command returns a password then a key will be generated from the password using a built-in key derivation function. Optionally, you can pass encryption_key as a hex encoded 256 bit key from any key store.
$cat /usr/local/pgsql/keypass

echo encryption_key=<sh /location/return-key.sh>
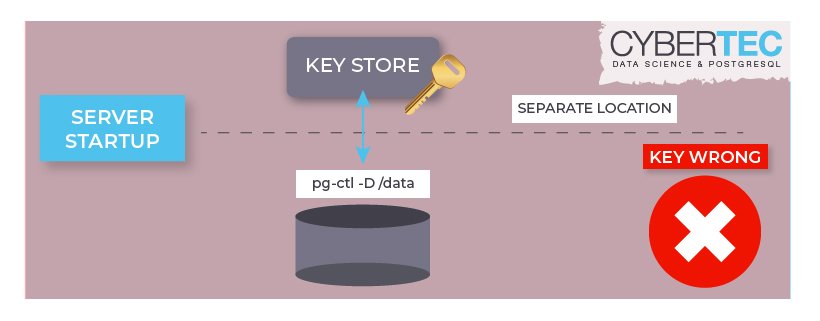
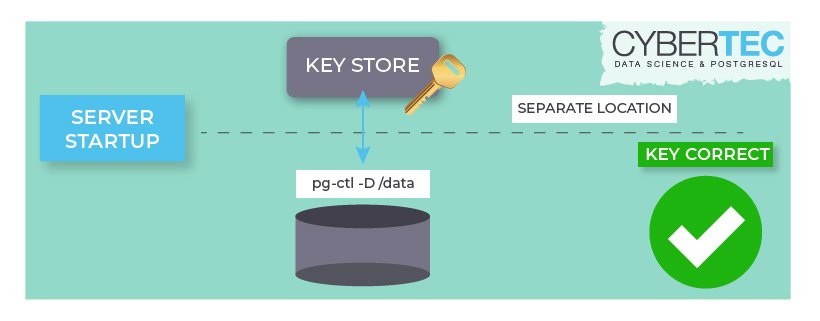
On completion, initdb stores the encryption key command to postgresql.conf. Thus, the user can control the cluster using pg_ctl without passing the encryption command again and again.
If encryption is enabled, full_page_writes must not be turned off, otherwise the server refuses to start. This is because the encryption introduces differences between data within a page, and therefore a server crash during a disk write can result in more serious damage of the page than it would do without encryption. The whole page needs to be retrieved from WAL in such a case to ensure reliable recovery.
vi postgresql.conf
full_page_writes = on
Once the PostgreSQL server is running, client applications should recognize no difference from an unencrypted cluster, except that data_encryption configuration variable is set.
Unlike pg_ctl, some of the server applications (for example pg_waldump) do not need the -K because they are not able to process the postgresql.conf file.
Since WAL is encrypted, any replication solution based on log shipping assumes that all standby servers are encrypted using the same key as their standby server. On the other hand, logica -replication allows replication between encrypted and unencrypted clusters, or between clusters encrypted with different keys.
PostgreSQL 12 is just around the corner and therefore we already want to present some of the new features we like. One important new feature gives users and devops the chance to control the behavior of the PostgreSQL optimizer. Prepared plans are always a major concern (especially people moving from Oracle seem to be most concerned) and therefore it makes sense to discuss the way plans are handled in PostgreSQL 12.
Firing up a PostgreSQL test database
To start I will create a simple table consisting of just two fields:
|
1 2 |
db12=# CREATE TABLE t_sample (id serial, name text); CREATE TABLE |
Then some data is loaded:
|
1 2 3 4 5 6 7 |
db12=# INSERT INTO t_sample (name) SELECT 'hans' FROM generate_series(1, 1000000); INSERT 0 1000000 db12=# INSERT INTO t_sample (name) SELECT 'paul' FROM generate_series(1, 2); INSERT 0 2 |
Note that 1 million names are identical (“hans”) and just two people are called “paul”. The distribution of data is therefore quite special, which has a major impact as you will see later in this post.
To show how plans can change depending on the setting, an index on “name” is defined as shown in the next listing:
|
1 2 |
db12=# CREATE INDEX idx_name ON t_sample (name); CREATE INDEX |
The PostgreSQL query optimizer at work
Let us run a simple query and see what happens:
|
1 2 3 4 5 6 7 8 9 10 11 |
db12=# explain SELECT count(*) FROM t_sample WHERE name = 'hans'; QUERY PLAN ------------------------------------------------------------------ Finalize Aggregate (cost=12656.23..12656.24 rows=1 width=8) -> Gather (cost=12656.01..12656.22 rows=2 width=8) Workers Planned: 2 -> Partial Aggregate (cost=11656.01..11656.02 rows=1 width=8) -> Parallel Seq Scan on t_sample (cost=0.00..10614.34 rows=416668 width=0) Filter: (name = 'hans'::text) (6 rows) |
In this case PostgreSQL decided to ignore the index and go for a sequential scan. It has even seen that the table is already quite large and opted for a parallel query. Still, what we see is a sequential scan. All data in the table has to be processed. Why is that? Remember: Most people in the table have the same name. It is faster to read the entire table and kick out those other ones instead of having to read almost the entire index. The planner figures (correctly) that running a sequential scan will be faster.
What you can take away from this example is that an index is not used because it exists - PostgreSQL uses indexes when they happen to make sense. If we search for a less frequent value, PostgreSQL will decide on using the index and offer us the optimal plan shown in the next listing:
|
1 2 3 4 5 6 7 8 |
db12=# explain SELECT count(*) FROM t_sample WHERE name = 'paul'; QUERY PLAN ------------------------------------------------ Aggregate (cost=4.45..4.46 rows=1 width=8) -> Index Only Scan using idx_name on t_sample (cost=0.42..4.44 rows=1 width=0) Index Cond: (name = 'paul'::text) (3 rows) |
Optimizer statistics: Fueling good performance
If you are looking for good performance, keeping an eye on optimizer statistics is definitely a good idea. The main question now is: Which data does the optimizer keep? pg_stats contains information about each column:
|
1 2 3 4 5 6 7 8 9 10 11 12 13 14 15 16 17 18 19 20 21 22 |
db12=# x Expanded display is on. db12=# SELECT * FROM pg_stats WHERE tablename = 't_sample' AND attname = 'name'; -[ RECORD 1 ] --------------------------+------------ schemaname | public tablename | t_sample attname | name inherited | f null_frac | 0 avg_width | 5 n_distinct | 1 most_common_vals | {hans} most_common_freqs | {1} histogram_bounds | correlation | 1 most_common_elems | most_common_elem_freqs | elem_count_histogram | |
PostgreSQL keeps track over the percentage of NULL entries in the table (null_frac). The average width of a column, the estimated number of distinct values (are all different, are all values the same). Then PostgreSQL keeps a list of the most frequent entries as well as their likelihood. The histogram_bounds column will contain the statistical distribution of data. In our example you will only find entries in this field if you are looking for the “id” column. There are only two names so keeping a histogram is basically pointless. The correlation column will tell us about the physical order of rows on disk. This field can be pretty important because it helps the optimizer to estimate the amount of I/O.
Preparing plans manually
If you send a query to PostgreSQL it is usually planned when the query is sent. However, if you explicitly want to prepare a query, you can make use of the PREPARE / EXECUTE commands. Here is how it works:
|
1 2 3 4 5 6 7 8 9 10 |
db12=# PREPARE myplan(text) AS SELECT count(*) FROM t_sample WHERE name = $1; PREPARE db12=# EXECUTE myplan('paul'); count ------- 2 (1 row) |
As you can see the following query will give us an indexscan:
|
1 2 3 4 5 6 7 8 |
db12=# explain EXECUTE myplan('paul'); QUERY PLAN ------------------------------------------------- Aggregate (cost=4.45..4.46 rows=1 width=8) -> Index Only Scan using idx_name on t_sample (cost=0.42..4.44 rows=1 width=0) Index Cond: (name = 'paul'::text) (3 rows) |
If we fall back to the more common value we will again get a parallel sequential scan:
|
1 2 3 4 5 6 7 8 9 10 11 |
db12=# explain EXECUTE myplan('hans'); QUERY PLAN ------------------------------------------------------------------- Finalize Aggregate (cost=12656.23..12656.24 rows=1 width=8) -> Gather (cost=12656.01..12656.22 rows=2 width=8) Workers Planned: 2 -> Partial Aggregate (cost=11656.01..11656.02 rows=1 width=8) -> Parallel Seq Scan on t_sample (cost=0.00..10614.34 rows=416668 width=0) Filter: (name = 'hans'::text) (6 rows) |
Why is that the case? In PostgreSQL life is not so straight forward. Even if we prepare explicitly we will still get a “fresh plan” before a generic plan is created. What is a generic plan? A generic plan is made assuming some constant parameters. The idea is to keep the plan and execute it multiple times in the hope that overall performance goes up due to lower planning overhead. Up to PostgreSQL 11 this process has been a bit “obscure” to most people.
Here is how the “obscure” thing works in detail. There are two ways PostgreSQL can choose for executing a prepared statement:
By default, PostgreSQL chooses a "middle road": it will generate a "custom plan"
during the first 5 executions of the prepared statement that takes the parameter values
into account. From the sixth execution on, it will check if the generic plan would
have performed as well (by comparing the estimated execution costs of the custom and
the generic plan). If it thinks that the generic plan would have done just as well,
the prepared statement will always use the generic plan from that point on.
PostgreSQL 12 introduces a new variable, which allows users to control the behavior more explicitly. Let us try the same thing again and enforce a generic plan:
|
1 2 3 4 5 6 7 8 9 10 11 12 13 14 15 16 17 18 19 20 21 22 23 24 25 26 27 28 29 30 |
db12=# SET plan_cache_mode = 'force_generic_plan'; SET db12=# PREPARE newplan(text) AS SELECT count(*) FROM t_sample WHERE name = $1; PREPARE db12=# explain EXECUTE newplan('hans'); QUERY PLAN ----------------------------------------------------------- Finalize Aggregate (cost=12656.23..12656.24 rows=1 width=8) -> Gather (cost=12656.01..12656.22 rows=2 width=8) Workers Planned: 2 -> Partial Aggregate (cost=11656.01..11656.02 rows=1 width=8) -> Parallel Seq Scan on t_sample (cost=0.00..10614.34 rows=416668 width=0) Filter: (name = $1) (6 rows) db12=# explain EXECUTE newplan('paul'); QUERY PLAN ------------------------------------------------------------------- Finalize Aggregate (cost=12656.23..12656.24 rows=1 width=8) -> Gather (cost=12656.01..12656.22 rows=2 width=8) Workers Planned: 2 -> Partial Aggregate (cost=11656.01..11656.02 rows=1 width=8) -> Parallel Seq Scan on t_sample (cost=0.00..10614.34 rows=416668 width=0) Filter: (name = $1) (6 rows) |
What you see here is that the plan is constant and PostgreSQL does not attempt replanning. Planning time will be cut BUT it does not necessarily mean that you always win. You might save on some CPU cycles to optimize the query but this of course means that the plan you are using is not necessarily optimal for your parameters.
plan_cache_mode: Valid parameters
If you want to play around with plan_cache_mode you can try the following values:
|
1 2 3 4 5 6 7 8 |
db12=# SET plan_cache_mode = 'force_custom_plan'; SET db12=# SET plan_cache_mode = 'force_generic_plan'; SET db12=# SET plan_cache_mode = 'auto'; SET |
"auto", which is the default value, resembles the traditional behavior of letting
PostgreSQL choose whether to use a generic plan or not.
You might ask what good it could be to use a prepared statement with "force_custom_plan".
The main reason is that using prepared statements is the best way to prevent SQL injection
attacks, so it may be worth using them even if you don't save on planning time.
If you want to learn more about PostgreSQL 12, consider checking out our blog post about optimizer support functions.
If you are relying heavily on the PostgreSQL COPY command to load data into PostgreSQL quickly, PostgreSQL 12 might offer a feature, which is most likely very beneficial to you. Bulkloading is an important operation and every improvement in this area is certainly going to help many people out there, who want to import data into PostgreSQL as fast as possible.
When taking a closer look at the syntax of the COPY command in PostgreSQL 12 you will quickly see two things:
• h will now point to the correct page in the documentation
• COPY now supports a WHERE condition
Here is the complete syntax overview:
|
1 2 3 4 5 6 7 8 9 10 11 12 13 14 15 16 17 18 19 20 21 22 23 24 25 26 27 28 |
db12=# h COPY Command: COPY Description: copy data between a file and a table Syntax: COPY table_name [ ( column_name [, ...] ) ] FROM { 'filename' | PROGRAM 'command' | STDIN } [ [ WITH ] ( option [, ...] ) ] [ WHERE condition ] COPY { table_name [ ( column_name [, ...] ) ] | ( query ) } TO { 'filename' | PROGRAM 'command' | STDOUT } [ [ WITH ] ( option [, ...] ) ] where option can be one of: FORMAT format_name FREEZE [ boolean ] DELIMITER 'delimiter_character' NULL 'null_string' HEADER [ boolean ] QUOTE 'quote_character' ESCAPE 'escape_character' FORCE_QUOTE { ( column_name [, ...] ) | * } FORCE_NOT_NULL ( column_name [, ...] ) FORCE_NULL ( column_name [, ...] ) ENCODING 'encoding_name' URL: https://www.postgresql.org/docs/12/sql-copy.html |
While having a link to the documentation around is certainly beneficial, the WHERE condition added to PostgreSQL 12 might even be more important. What is the purpose of this new feature? So far it was possible to completely import a file. However, in some cases this has been a problem: More often than not people only wanted to load a subset of data and had to write a ton of code to filter data before the import or once data has been written into the database already.
In PostgreSQL data can be filtered while importing easily. The COPY become is pretty flexible and allows a lot of trickery. To show you, how the new WHERE clause works, I have compiled a simple example:
|
1 2 3 |
db12=# CREATE TABLE t_demo AS SELECT * FROM generate_series(1, 1000) AS id; SELECT 1000 |
First of all 1000 rows are generated to make sure that we got some data to play. Then we export the content of this table to a file:
|
1 2 |
db12=# COPY t_demo TO '/tmp/file.txt'; COPY 1000 |
Finally, we can try to import this data again:
|
1 2 3 4 5 6 7 8 9 10 11 12 |
db12=# CREATE TABLE t_import (x int); CREATE TABLE db12=# COPY t_import FROM '/tmp/file.txt' WHERE x < 5; COPY 4 db12=# SELECT * FROM t_import; x --- 1 2 3 4 (4 rows) |
As you can see filtering data is pretty simple and very straight forward. One important thing to note here is: I exported an “id” column and imported it as “x”. Keep in mind that the text file does not know the data structure of our target table - you have to make sure that you filter on the column name of the table you want to import.
If you are new to PostgreSQL in general I also want to present one of the older features, which I like a lot personally. COPY can send data to the UNIX pipe or read data from a pipe. Here is how it works:
|
1 2 3 4 5 6 7 8 9 10 11 12 13 |
db12=# COPY t_demo TO PROGRAM 'gzip -c > /tmp/file.txt.gz'; COPY 1000 db12=# COPY t_import FROM PROGRAM 'gunzip -c /tmp/file.txt.gz' WHERE x BETWEEN 100 AND 103; COPY 4 db12=# SELECT * FROM t_import WHERE x >= 100; x ----- 100 101 102 103 (4 rows) |
In some cases, you might want to do more than to just export data. In this case I decided to compress the data while exporting. Before the data is imported again it is uncompressed and again filtered. As you can see it is pretty simple to combine those features in a flexible way.
If you want to learn more about PostgreSQL and loading data in general, check out our post about rules and triggers. If you want to learn more about COPY, checkout the PostgreSQL documentation.
+43 (0) 2622 93022-0
office@cybertec.at