
You might, at first glance, believe that DROP ROLE (or DROP USER, which is the same) is a simple matter. However, that's not always the case. So I thought it might be a good idea to show you the problems involved and how to solve them.
DROP ROLE ... CASCADE?PostgreSQL tracks dependencies between objects in the system catalogs pg_depend and pg_shdepend. Sometimes, dropping an object automatically drops other associated objects: for example, dropping a table will drop all indexes and triggers associated with the table. In other cases, you get an error if you drop an object with dependencies: for example, you can't drop a schema that still contains other objects.
The usual way to automatically drop all dependent objects is to use the CASCADE option. For example, “DROP SCHEMA schema_name CASCADE” will automatically try to drop all objects in the schema. So it comes as a surprise that there is no CASCADE option for DROP ROLE. Now what is the reason? Consider these facts:
As a consequence, PostgreSQL cannot guarantee that a single statement will get rid of all objects that depend on a role. So we can't have a CASCADE option for DROP ROLE that can drop all dependent objects.
DROP ROLE?The best thing you can do is to never drop a role that owns objects or has permissions. That's easy to accomplish, if you use “group roles” to carry permissions and ownership, and if you make sure that roles that might be dropped are members of these group roles. That way, the roles inherit all privileges, and you can still drop them at any time. For example, you could have a role “readonly” that has read permissions on everything, and if you temporarily need a role with read access, you just make that role a member of readonly.
Another advantage of using group roles is that you don't have to grant the same permissions to several roles. Not only is that cumbersome and error-prone, but it also inflates the “access control lists” on the objects.
DROP OWNED BY and REASSIGN OWNED BYPostgreSQL has a utility command DROP OWNED BY that drops all objects owned by a role in the current database. It also revokes all permissions granted to the role in the current database. So you can get rid of most objects with dependencies to a role by connecting to all databases in turn and running “DROP OWNED BY role_name” in each of them.
Note that this may still fail: some of the objects that DROP OWNED BY wants to drop might have dependencies to objects owned by other roles, which prevent PostgreSQL from dropping them. In that case, you can use “DROP OWNED BY role_name CASCADE” to have the DROP cascade to these dependent objects.
An alternative to dropping the objects is to change their ownership to a different role. You can do that in bulk with REASSIGN OWNED BY. Again, this only affects objects in the current database, so you have to issue REASSIGN OWNED BY in all databases with objects owned by the role you want to get rid of. Note: REASSIGN OWNED BY does not modify or remove permissions granted to the role, so you may want to follow it with DROP OWNED BY to revoke those permissions.
DROP OWNED BYThere are only two kinds of objects that might be left behind by DROP OWNED BY, both of which are not part of any database:
Getting rid of the databases is easy: you connect to database postgres and drop them or change their ownership.
Tablespaces are more difficult: you cannot drop a tablespace unless there are no more objects in that tablespace. This is a similar case to roles, since a tablespace can contain objects from different databases. Consequently, there is also no CASCADE option for DROP TABLESPACE. In practice, you will probably end up changing the ownership of the tablespace to a different role.
postgres”!There is one special role in each PostgreSQL cluster: the bootstrap superuser created during initdb. Usually that role is called “postgres”, but it always has the object ID 10. If you attempt to drop that role or use DROP OWNED BY and REASSIGN OWNED BY on it, you end up with these error messages:
|
1 2 3 |
cannot drop role postgres because it is required by the database system cannot drop objects owned by role postgres because they are required by the database system cannot reassign ownership of objects owned by role postgres because they are required by the database system |
You always need the bootstrap superuser, so you can't remove it. If you don't like the name of the user, you can simply rename it with ALTER ROLE ... RENAME TO .... Object names are only tags in PostgreSQL and you can change them at any time.
With DROP OWNED BY and REASSIGN OWNED BY it is not difficult to get rid of a role (user), even if it has many dependencies. Still better is to avoid the problem from the start by not granting permissions to roles that might get deleted. Use group roles for that!
If you are interested in tracking permissions in a PostgreSQL database, read more about it here in Hans' blog: pg_permissions.
In order to receive regular updates on important changes in PostgreSQL, subscribe to our newsletter, or follow us on Twitter, Facebook, or LinkedIn.
Recently, I could help solve a “mysterious” performance problem for a customer. The problem turned out to be a badly chosen query parameter type, which led to poor query performance. After working on this customer's case, I realized that the meaning of the data type of a query parameter is not universally understood, which is why I decided to write this article.
In SQL, we often encounter queries that only differ in constant values, for example
|
1 2 3 |
SELECT val FROM large WHERE id = 42; SELECT val FROM large WHERE id = 4711; SELECT val FROM large WHERE id = 1001; |
It makes sense to consider them as different instances of the same query:
|
1 |
SELECT val FROM large WHERE id = $1; |
Here, $1 is a placeholder for an arbitrary value. Such a placeholder is called a query parameter (also known as a bind variable). When you execute the query, you have to supply an actual parameter value as an argument for the parameter.
Using a placeholder has several advantages:
The PostgreSQL frontend/backend protocol provides two ways to send an SQL statement:
$1, $1 etc.Note that you can use query parameters only for constants. It is not possible to use parameters for identifiers like table, column or schema names. Also, parameters are only supported in SELECT, INSERT, UPDATE and DELETE.
When you prepare a statement, you can assign it a name, so that the same statement can be executed with different parameter values. This is called a prepared statement, and every database client API provides support for that.
Using JDBC in Java, that would work as follows:
|
1 2 3 4 |
java.sql.PreparedStatement stmt = conn.prepareStatement('SELECT * FROM large WHERE id = ?'); stmt.setLong(1, 42L); java.sql.ResultSet rs = stmt.executeQuery(); |
The placeholder is always ?, and the first argument of the set* methods specifies the parameter number.
In PostgreSQL, you can also use prepared statements in SQL. PREPARE creates a prepared statement, and EXECUTE executes it:
|
1 2 3 4 |
PREPARE stmt(bigint) AS SELECT val FROM large WHERE id = $1; EXECUTE stmt(42); |
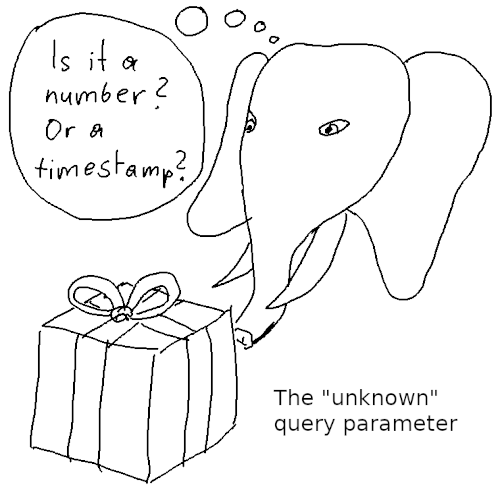
You may have noticed that in both of the above cases, there was a data type associated with the parameter: long in Java and bigint in SQL. However, you don't have to specify a data type. Then PostgreSQL will try to infer the data type itself. Such an “untyped value” is represented by the data type “unknown” in PostgreSQL.
But PostgreSQL will also consider type conversions for data types other than unknown. For example, there is no equality operator to compare bigint and numeric in PostgreSQL:
|
1 2 3 4 5 6 7 8 9 10 11 12 13 14 |
SELECT o.oprname FROM pg_operator AS o JOIN pg_amop AS ao ON o.oid = ao.amopopr JOIN pg_am AS a ON a.oid = ao.amopmethod WHERE /* an equality operator as used in B-tree indexes */ ao.amopstrategy = 3 AND a.amname = 'btree' AND (o.oprleft, o.oprright) = ('bigint'::regtype, 'numeric'::regtype); oprname ═════════ (0 rows) |
Still, you can compare a bigint with a numeric, because PostgreSQL will implicitly convert the bigint to a numeric, as the latter is the preferred data type for numbers. You can find the exact rules that govern these conversions in the documentation. These rules are quite complicated, because PostgreSQL supports overloading for functions and operators.
To illustrate that, let's consider this simple example:
|
1 2 3 4 5 6 7 8 9 10 |
CREATE TABLE large ( id bigint GENERATED ALWAYS AS IDENTITY PRIMARY KEY, val double precision NOT NULL ); INSERT INTO large (val) SELECT random() FROM generate_series(1, 100000); VACUUM (ANALYZE) large; |
Then we write a Java program that queries the database with the code snippet from above, but we set the parameter in three different ways. Using the auto_explain extension, we capture the execution plan on the server in each case.
integer as the parameter typeThe parameter is set with
|
1 |
stmt.setInt(1, 42); |
and the resulting execution plan is
|
1 2 3 4 5 |
Query Text: SELECT * FROM large WHERE id = $1 Index Scan using large_pkey on large (...) (actual time=0.013..0.013 rows=1 loops=1) Index Cond: (id = 42) Buffers: shared hit=3 |
This works fine, since setInt marks the parameter as type integer, and there is an equality operator to compare integer and bigint.
unknown as the parameter typeThe parameter is set as type java.sql.Types.OTHER with
|
1 |
stmt.setObject(1, 42); |
and the resulting execution plan is
|
1 2 3 4 5 |
Query Text: SELECT * FROM large WHERE id = $1 Index Scan using large_pkey on large (...) (actual time=0.005..0.006 rows=1 loops=1) Index Cond: (id = 42) Buffers: shared hit=3 |
This works just as well, because a parameter of type unknown is inferred to have the same type as id, which is bigint.
numeric as the parameter typeThe parameter is set with
|
1 |
stmt.setBigDecimal(1, java.math.BigDecimal.valueOf(42)); |
and the resulting execution plan is
|
1 2 3 4 5 6 |
Query Text: SELECT * FROM large WHERE id = $1 Seq Scan on large (...) (actual time=0.012..11.123 rows=1 loops=1) Filter: ((id)::numeric = '42'::numeric) Rows Removed by Filter: 99999 Buffers: shared hit=935 |
Surprisingly, PostgreSQL used a sequential scan, and the performance is much worse. The reason is that the JDBC driver maps java.math.BigDecimal to numeric, so the parameter has the data type numeric. As we have seen above, there is no equality operator for bigint and numeric, so PostgreSQL converts both to numeric. This is clearly visible in the execution plan above. Since the primary key index is defined on “id” and not on “id::numeric”, it cannot be used in this case.
From the above, we can learn the following lesson:
setLong, since the JDBC driver maps long to bigint.unknown) and let PostgreSQL infer the correct data type.Sometimes both of these strategies won't work, because there is no data type in your host language that matches the PostgreSQL data type - and PostgreSQL guesses wrong. An example would be this query:
|
1 2 |
SELECT id, name FROM person WHERE birthday <= current_timestamp - $1; |
We want to supply an interval like “1 year” or “1-0”. Java does not have a data type for intervals, so we would have to send an unknown parameter. However, PostgreSQL infers that we mean the operator
|
1 |
timestamp with time zone - timestamp with time zone |
rather than
|
1 |
timestamp with time zone - interval |
so we will end up with error messages complaining that “1 year” is not a valid timestamp. In this case, the solution is to add an explicit type cast to the statement:
|
1 2 |
SELECT id, name FROM person WHERE birthday <= current_timestamp - CAST ($1 AS interval); |
So we have to amend the above list with a third point:
It is easy to overlook the fact that the data type of a query parameter can matter for query performance. To avoid problems, either don't specify a type and let PostgreSQL do the right thing, or explicitly specify the correct type.
If you want to read more about PostgreSQL query protocol and performance, perhaps you would be interested in my article on pipeline mode.
It is known that high network latency is bad for database performance. PostgreSQL v14 has introduced “pipeline mode” for the libpq C API, which is particularly useful to get decent performance over high-latency network connections. If you are using a hosted database in “the cloud”, then this article might be interesting for you.
To understand pipeline mode, we have to understand the message flow between client and server. Using the extended query protocol, statements get processed as follows:
The database transaction is finished by sending a “Sync” message. These messages are typically sent in a single TCP packet. All of the above messages are generated by a call to the PQexec or PQexecParams functions of libpq. In the case of a prepared statement, the “Parse” step is separated from the “Bind” and “Execute” steps.
After “Sync” has been sent, the client waits for a response from the server. The server processes the statement and replies with
Finally, the server sends a “ReadyForQuery” message to indicate that the transaction is complete and it is ready for more. Again, these messages are typically sent in a single TCP packet.
Pipeline mode is nothing new on the frontend/backend protocol level. It just relies on the fact that you can send more than one statement before sending “Sync”. This allows you to send multiple statements in a single transaction without waiting for a response from the server. What is new is support for this from the libpq API. PostgreSQL v14 introduced the following new functions:
PQenterPipelineMode: enter pipeline modePQsendFlushRequest: sends a “Flush” message to tell the server to start sending back responses to previous requests right away (otherwise, the server tries to bundle all responses into a single TCP packet)PQpipelineSync: sends a “Sync” message – you must call this explicitlyPQexitPipelineMode: leave pipeline modePQpipelineStatus: shows if libpq is in pipeline mode or notThe statements themselves are sent using the asynchronous query execution functions PQsendQuery, PQsendQueryParams and PQsendQueryPrepared, and after the “Sync” message has been sent, PQgetResult is used to receive the responses.
Since all that does not rely on new features in the frontend/backend protocol, you can use pipeline mode with older versions of the PostgreSQL server.
Let's assume the case of a simple money transfer using a table like
|
1 2 3 4 5 |
CREATE TABLE account ( id bigint PRIMARY KEY, holder text NOT NULL, amount numeric(15,2) NOT NULL ); |
To transfer money from one account to the other, we have to run a transaction like
|
1 2 3 4 |
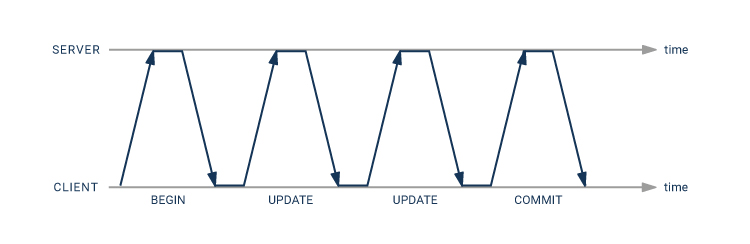
BEGIN; UPDATE account SET amount = amount + 100 WHERE id = 42; UPDATE account SET amount = amount - 100 WHERE id = 314; COMMIT; |
With normal processing, that makes four round trips from the client to the server, so the whole transaction will incur eight times the network latency.
Using the pipeline mode, you can get away with only twice the network latency:
UPDATE statement can be sent immediately after the first one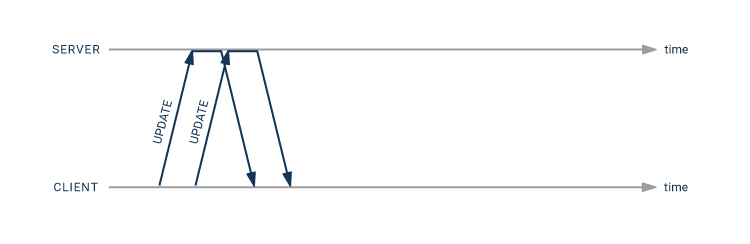
This is C code that can be used to process the above transaction. It uses a prepared statement stmt for this UPDATE statement:
|
1 2 3 4 |
UPDATE account SET amount = amount + $2 WHERE id = $1 RETURNING amount; |
In order to focus on the matter at hand, I have omitted the code to establish a database connection and prepare the statement.
|
1 2 3 4 5 6 7 8 9 10 11 12 13 14 15 16 17 18 19 20 21 22 23 24 25 26 27 28 29 30 31 32 33 34 35 36 37 38 39 40 41 42 43 44 45 46 47 48 49 50 51 52 53 54 55 56 57 58 59 60 61 62 63 64 65 66 67 68 69 70 71 72 73 74 75 76 77 78 79 80 81 82 83 84 85 86 87 88 89 90 91 92 93 94 95 96 97 98 99 100 101 102 103 104 105 106 107 108 109 110 111 112 113 114 115 116 117 118 119 120 121 122 123 124 125 126 127 128 129 130 131 132 133 134 135 136 137 138 139 140 141 142 143 144 145 146 147 148 149 150 151 152 153 154 155 156 157 158 159 160 161 162 163 164 165 166 167 168 169 170 171 172 173 174 175 176 177 178 179 180 181 182 |
#include <libpq-fe.h> #include <stdio.h> /* * Receive and check a statement result. * If 'res' is NULL, we expect a NULL result and * print the message if we get anything else. * If 'res' is not NULL, the result is stored there. * In that case, if the result status is different * from 'expected_status', print the message. */ static int checkResult(PGconn *conn, PGresult **res, ExecStatusType expected_status, char * const message) { PGresult *r; if (res == NULL) { if ((r = PQgetResult(conn)) == NULL) return 0; PQclear(r); fprintf(stderr, '%s: unexpected resultn', message); return 1; } if ((*res = PQgetResult(conn)) == NULL) { fprintf(stderr, '%s: missing resultn', message); return 1; } if (PQresultStatus(*res) == expected_status) return 0; fprintf(stderr, '%s: %sn', message, PQresultErrorMessage(*res)); PQclear(*res); return 1; } /* transfer 'amount' from 'from_acct' to 'to_acct' */ static int transfer(PGconn *conn, int from_acct, int to_acct, double amount) { PGresult *res; int rc; char acct[100], amt[100]; /* will fit a number */ char * const values[] = { acct, amt }; /* parameters */ /* enter pipeline mode */ if (!PQenterPipelineMode(conn)) { fprintf(stderr, 'Cannot enter pipeline mode: %sn', PQerrorMessage(conn)); return 1; } /* send query to subtract amount from the first account */ snprintf(values[0], 100, '%d', from_acct); snprintf(values[1], 100, '%.2f', -amount); if (!PQsendQueryPrepared(conn, 'stmt', /* statement name */ 2, /* parameter count */ (const char * const *) values, NULL, /* parameter lengths */ NULL, /* text parameters */ 0)) /* text result */ { fprintf(stderr, 'Error queuing first update: %sn', PQerrorMessage(conn)); rc = 1; } /* * Tell the server that it should start returning results * right now rather than wait and gather the results for * the whole pipeline in a single packet. * There is no great benefit for short statements like these, * but it can reduce the time until we get the first result. */ if (rc == 0 && PQsendFlushRequest(conn) == 0) { fprintf(stderr, 'Error queuing flush requestn'); rc = 1; } /* * Dispatch pipelined commands to the server. * There is no great benefit for short statements like these, * but it can reduce the time until we get the first result. */ if (rc == 0 && PQflush(conn) == -1) { fprintf(stderr, 'Error flushing data to the server: %sn', PQerrorMessage(conn)); rc = 1; } /* send query to add amount to the second account */ snprintf(values[0], 100, '%d', to_acct); snprintf(values[1], 100, '%.2f', amount); if (rc == 0 && !PQsendQueryPrepared(conn, 'stmt', /* statement name */ 2, /* parameter count */ (const char * const *) values, NULL, /* parameter lengths */ NULL, /* text parameters */ 0)) /* text result */ { fprintf(stderr, 'Error queuing second update: %sn', PQerrorMessage(conn)); rc = 1; } /*--- * Send a 'sync' request: * - flush the remaining statements * - end the transaction * - wait for results */ if (PQpipelineSync(conn) == 0) { fprintf(stderr, 'Error sending 'sync' request: %sn', PQerrorMessage(conn)); rc = 1; } /* consume the first statement result */ if (checkResult(conn, &res, PGRES_TUPLES_OK, 'first update')) rc = 1; else printf('Account %d now has %sn', from_acct, PQgetvalue(res, 0, 0)); if (res != NULL) PQclear(res); /* the next call must return nothing */ if (checkResult(conn, NULL, -1, 'end of first result set')) rc = 1; /* consume the second statement result */ if (checkResult(conn, &res, PGRES_TUPLES_OK, 'second update')) rc = 1; else printf('Account %d now has %sn', to_acct, PQgetvalue(res, 0, 0)); if (res != NULL) PQclear(res); /* the next call must return nothing */ if (checkResult(conn, NULL, -1, 'end of second result set')) rc = 1; /* consume the 'ReadyForQuery' response */ if (checkResult(conn, &res, PGRES_PIPELINE_SYNC, 'sync result')) rc = 1; else if (res != NULL) PQclear(res); /* exit pipeline mode */ if (PQexitPipelineMode(conn) == 0) { fprintf(stderr, 'error ending pipeline mode: %sn', PQresultErrorMessage(res)); rc = 1; } return rc; } |
To verify the improvement in speed , I used the tc utility on my Linux system to artificially add a 50 millisecond latency to the loopback interface:
|
1 |
sudo tc qdisc add dev lo root netem delay 50ms |
This can be reset with
|
1 |
sudo tc qdisc del dev lo root netem |
I measured the time spent in the above function, as well as the time for a function that used no pipeline and an explicit transaction:
| no pipeline (8 times network latency) | pipeline (2 times network latency) | |
|---|---|---|
| first attempt | 406 ms | 111 ms |
| second attempt | 414 ms | 104 ms |
| third attempt | 414 ms | 103 ms |
With short SQL statements like these, the speed gain from pipelining is almost proportional to the client-server round trips saved.
If you don't want to use the libpq C API or directly speak the frontend/backend protocol, there is another way to get a similar performance improvement: you can write a PL/pgSQL function or procedure.
|
1 2 3 4 5 6 7 8 9 10 11 12 13 14 |
CREATE PROCEDURE transfer( p_from_acct bigint, p_to_acct bigint, p_amount numeric ) LANGUAGE plpgsql AS $$BEGIN UPDATE account SET amount = amount - p_amount WHERE id = p_from_acct; UPDATE account SET amount = amount + p_amount WHERE id = p_to_acct; END;$$; |
This will also run inside a single transaction and is just as fast, because
CALL statementWriting a PL/pgSQL procedure is in this case probably the simpler solution. However, pipeline mode allows you precise control over the message and data flow between client and server, which you won't get with a function.
You may not be able to use this solution in case you operate in an environment where database functions are an anathema. But then, strictly held religious beliefs can be expected to make you suffer occasionally!
Pipeline mode, new with the libpq C API in PostgreSQL v14, allows for considerable performance improvements with laggy network connections. Since it doesn't use new features in the frontend/backend protocol, it can be used with old server versions as well. Often, similar performance gains can be achieved using PL/pgSQL functions.
If you are interested in data manipulation performance, you may want to read my article about HOT updates.
There are certain types of questions which accompany any PostgreSQL consultant throughout his or her entire career. Invariably, one of those questions is: “How can we compare the content of two tables?” This is an important thing to know, because we might want to ensure that data is identical after a migration, or perhaps we want to verify that data has not been corrupted during storage. These questions arise so frequently that it was necessary to come up with a speedy solution for comparing the content of tables. The answer lies in creating checksums for tables.
On a Linux system you normally use a program such as md5sum to get the checksum, or "digital fingerprint", of a file. Here's how it works:
|
1 2 |
[hs@fedora ~]$ md5sum /tmp/file.txt d41d8cd98f00b204e9800998ecf8427e /tmp/file.txt |
md5sum is a widely-used method to obtain checksums. Checksums can be compared more easily than entire files - especially when those files are large.
The question which naturally arises is: How can we achieve the same thing in a database? What can we do in SQL to create such a checksum?
The solution to the problem in SQL is to use an “ordered set”. Now what is that? Here is an example of a simple ordered set:
|
1 2 3 4 5 6 7 8 9 |
test=# SELECT id % 2 AS grp, percentile_disc(0.5) WITHIN GROUP (ORDER BY id) FROM generate_series(1, 43243) AS id GROUP BY 1; grp | percentile_disc ----+----------------- 0 | 21622 1 | 21621 (2 rows) |
This is the SQL way to calculate a median value. What happens is: The generate_series function creates values from 1 to 43243 (one row per value). The GROUP BY clause dissects them into 2 groups. One group will contain odd numbers and the other group will contain even numbers. The trick is: If we calculate the average (mean) number, the order of data does not matter. Suppose we have 1, 2, 3, 4, 5: The average will always be 3 - regardless of the order. However, how does a median work? We order the data and then we go 50% into the ordered data set - percentile_disc(0.5) does exactly that. Finding the “middle” value does not work without order.
The same is true for checksums. If we want to create a fingerprint for a table, the order of entries does matter. Identical data in a different order will lead to different results - and we want to avoid that.
To solve this problem, we implement an ordered set which consumes sorted data and produces a checksum.
Before we implement the ordered set we need to see what's already available in PostgreSQL:
|
1 2 3 4 5 |
test=# SELECT md5('hans'); md5 ---------------------------------- f2a0ffe83ec8d44f2be4b624b0f47dde (1 row) |
A simple md5 function is available, but there's no corresponding aggregate. We need to define one. Here's how it works:
|
1 2 3 4 5 6 7 8 9 10 11 12 13 |
CREATE FUNCTION md5_agg_sfunc(text, anyelement) RETURNS text LANGUAGE sql AS $ SELECT md5($1 || $2::text) $; CREATE AGGREGATE md5_agg (ORDER BY anyelement) ( STYPE = text, SFUNC = md5_agg_sfunc, INITCOND = '' ); |
An “ordered set” needs an INITCOND. We initialize an empty string. The general idea is: We take a string, add the next row and turn it into a checksum. Then we add a row, turn it into a checksum and so on. We do that as long as there is data. Basically, it is a checksum over checksums, to ensure that the amount of data we're working on is never too large to fit into memory. For every row in the loop, we call SFUNC (in our case, md5_agg_sfunc).
In the context of an ordered set, one thing is of great importance: You might have guessed it - it is order. We use a little trick here:
|
1 2 3 4 5 6 7 |
test=# CREATE TABLE t_test (a int, b int); CREATE TABLE test=# INSERT INTO t_test SELECT x, x + 10 FROM generate_series(1, 1000) AS x; INSERT 0 1000 |
After loading some data, we can identify what's possible:
|
1 2 3 4 5 6 7 |
test=# SELECT * FROM t_test ORDER BY t_test LIMIT 3; a | b ---+---- 1 | 11 2 | 12 3 | 13 (3 rows) |
Note that we're actually sorting by the “table”. What that means is that we're sorting by every column (so in our case, ORDER BY a, b). This is important, as you will see in a moment.
It's also possible is to use an entire row just like a column:
|
1 2 3 4 5 6 7 |
test=# SELECT t_test FROM t_test ORDER BY t_test LIMIT 3; t_test -------- (1,11) (2,12) (3,13) (3 rows) |
That is convenient: Let's recap the definition of the aggregate:
CREATE AGGREGATE md5_agg (ORDER BY anyelement)...
What we see here is that the aggregate can basically order by “anything”. So, as in this case, we fully exploit that. As long as a row can be sorted, we can use it for our checksums:
|
1 2 3 4 5 |
test=# SELECT md5_agg() WITHIN GROUP (ORDER BY t_test) FROM t_test; md5_agg ---------------------------------- d8586008a105a1cac121818f30841eec (1 row) |
We've successfully created a checksum for this table. Of course, we can also checksum subsets of data:
|
1 2 3 4 5 6 7 8 9 10 11 |
test=# SELECT a % 2 AS grp, md5_agg() WITHIN GROUP (ORDER BY t_test) FROM t_test GROUP BY a % 2; grp | md5_agg -----+---------------------------------- 0 | 7e310dd10088ae69ab8d8a2b66e36aa2 1 | 62f385154b241e74be8c91de150550c6 (2 rows) |
We can always use a GROUP BY statement to split the data into groups.
Creating checksums can be incredibly useful to help ensure the quality of your data. However, there is more. If you really want to protect your data and ensure maximum security, we suggest taking a look at PostgreSQL TDE which offers a way to encrypt data on disk. TDE is part of PGEE. Check out our blog post about managing encryption keys with PostgreSQL TDE to read more.
In order to receive regular updates on important changes in PostgreSQL, subscribe to our newsletter, or follow us on Facebook or LinkedIn.
We want to announce that the beta release of pgwatch2 v1.9 is now available for download. This release contains previews of all features that will be available in the final release of pgwatch2 v1.9, though some details of the release could change before then.
You can find information about all of the new features and changes in pgwatch2 v1.9 within the release notes.
In the spirit of open-source software, we strongly encourage you to test the new features of pgwatch2 v1.9 on your systems to help us eliminate any bugs or other issues that may exist. While we don't advise you to run pgwatch2 v1.9.0-beta in your production environments, we encourage you to find ways to run your typical application workloads against this beta release.
It has been a long time since our previous release. And even though pgwatch2 v1.9 is not considered a major upgrade, there are a lot of impressive changes.
First of all, we have a new maintainer for pgwatch2. That's me, Pavlo Golub. I hope Kaarel Moppel, the author of pgwatch2, will still work on the project - but now without the extra burden of support and maintenance.
We've used the latest Go v1.17 for all binaries and Docker images.
We now have full PostgreSQL v14 support and support for the latest Grafana v8 visualization solution. For those who still use the previous versions of Grafana, we also added support for v7 and v6 dashboards.
To improve our CI/CD experience and automate some tasks, we've introduced three GitHub Actions in a series of planned workflows:
ReleaseCodeQL analysisClose Stale Issues and PRsRelease workflow will automatically build all artifacts, including Docker images, and publish the release.CodeQL analysis stands guard over code security. It will thoroughly investigate each pull request and each push.
It's not a surprise that many issues are created for open-source projects which never get a follow-up contribution from the topic starter. We have enabled a Close Stale Issues and PRs workflow to keep up with the continuous storm of new issues and PRs. It will mark issues and PRs with no activity as stale, and eventually close them.
We added many more cool features, like new gatherer options, e.g. --try-create-listed-exts-if-missing. Or like new metrics for monitoring "wait_events".
We provided many code modifications to improve performance.
Prometheus-mode monitoring is now one of the essential optimizations.
We rewrote the gatherer code to skip tables without waiting for AccessExclusiveLock.
We've added a new --min-db-size-mb flag to ignore "empty" databases. It allows the gatherer to skip measures fetching for empty or for small-sized databases.
pgwatch2 v1.9 comes with fully redesigned connection pooling, which will hardly rely on sqlx.DB from now on.
Timeouts have been greatly increased for database and table size fetching - to 5min.
Metric fetching was made less disruptive by setting a short lock_timeout.
The new --no-helper-functions parameter allows you to skip metric definitions which rely on helper functions. This mode makes working with managed instances more fluid, with fewer errors in logs. It uses the SU or superuser version of a metric immediately when available, and not after the first failed call.
The new --emergency-pause-triggerfile flag aims to quickly shut down collectors. The main idea of the feature is to quickly free monitored databases and networks of any extra "monitoring effect" load.
You'll find many other new features and improvements in pgwatch2 v1.9. Some may be more important to your use case than those highlighted above. Please see the documentation for the latest information.
The stability of each pgwatch2 v1.9 release significantly depends on the community's effort to test the upcoming version with your workloads and testing tools, in order to find bugs and regressions before pgwatch2 v1.9 becomes generally available. As this is a Beta, minor changes and bug fixes are still possible. Your feedback and testing will help determine the final tweaks on the new features, so please test as soon as possible. The quality of user testing helps decide when we can make an official release.
A list of open issues is publicly available in the pgwatch2 repository. You can report bugs using this form: https://github.com/cybertec-postgresql/pgwatch2/issues.