After 20 years in professional PostgreSQL support and consulting we are finally able to answer one of the most frequently asked questions: “How can I see all active query/ execution plans?" Ladies and gentlemen, let me introduce you to pg_show_plans, an extension which does exactly that. pg_show_plans is Open Source and can be used free of charge as a standard PostgreSQL extension. It will help people to diagnose problems more efficiently and help to digging into more profound performance issues.
Table of Contents
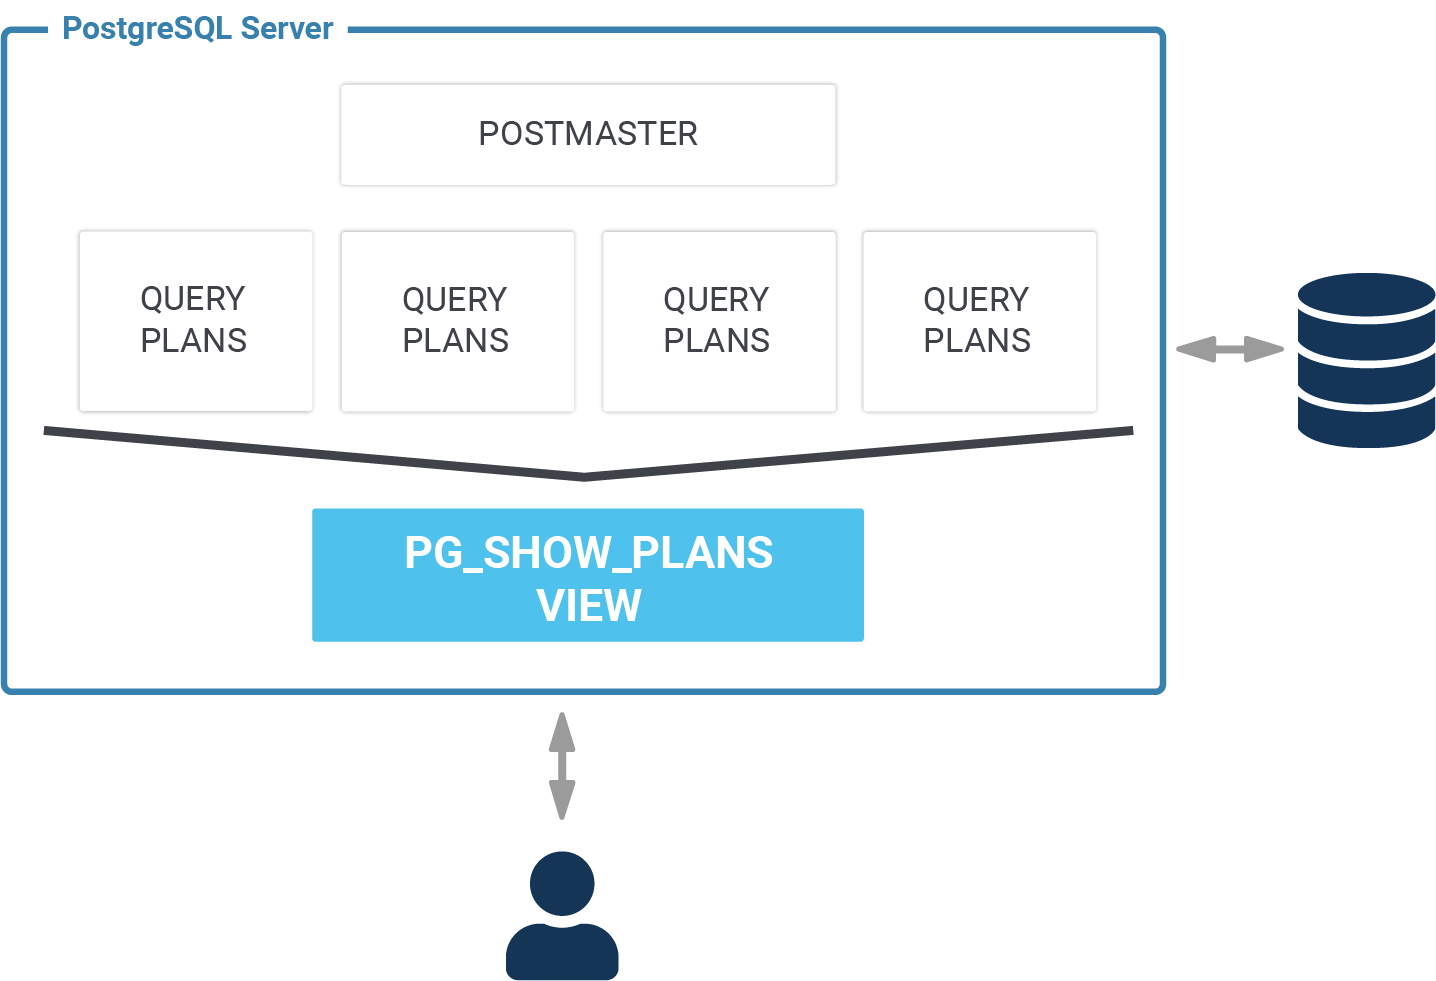
pg_show_plans uses a set of hooks in the PostgreSQL core to extract all the relevant information. These plans are then stored in shared memory and exposed via a view. This makes it possible to access these plans in an easy way.
The performance overhead of pg_show_plans will be discussed in a future blog post. Stay tuned for more information and visit our blog on a regular basis.
pg_show_plans is available on GitHub for free and can be used free of charge.
Just clone the GitHub repo:
|
1 2 3 4 5 6 7 |
iMac:src hs$ git clone https://github.com/cybertec-postgresql/pg_show_plans.git Cloning into 'pg_show_plans'... remote: Enumerating objects: 54, done. remote: Counting objects: 100% (54/54), done. remote: Compressing objects: 100% (25/25), done. remote: Total 54 (delta 31), reused 52 (delta 29), pack-reused 0 Unpacking objects: 100% (54/54), done. |
Then “cd” into the directory and set USE_PGXS. USE_PGXS is important if you want to compile the code outside of the PostgreSQL source tree:
|
1 2 |
iMac:src hs$ cd pg_show_plans iMac:pg_show_plans hs$ export USE_PGXS=1 |
|
1 2 3 4 5 6 7 8 9 10 11 12 13 14 15 16 17 18 19 |
iMac:pg_show_plans hs$ make gcc -Wall -Wmissing-prototypes -Wpointer-arith -Wdeclaration-after-statement -Werror=vla -Wendif-labels -Wmissing-format-attribute -Wformat-security -fno-strict-aliasing -fwrapv -Wno-unused-command-line-argument -g -O2; -I. -I./ -I/Users/hs/pg12/include/postgresql/server -I/Users/hs/pg12/include/postgresql/internal; -c -o pg_show_plans.o pg_show_plans.c gcc -Wall -Wmissing-prototypes -Wpointer-arith -Wdeclaration-after-statement -Werror=vla -Wendif-labels -Wmissing-format-attribute -Wformat-security -fno-strict-aliasing -fwrapv -Wno-unused-command-line-argument -g -O2; -bundle -multiply_defined suppress -o pg_show_plans.so pg_show_plans.o -L/Users/hs/pg12/lib -Wl,-dead_strip_dylibs -bundle_loader /Users/hs/pg12/bin/postgres iMac:pg_show_plans hs$ make install /opt/local/bin/gmkdir -p '/Users/hs/pg12/lib/postgresql' /opt/local/bin/gmkdir -p '/Users/hs/pg12/share/postgresql/extension' /opt/local/bin/gmkdir -p '/Users/hs/pg12/share/postgresql/extension' /opt/local/bin/ginstall -c -m 755 pg_show_plans.so '/Users/hs/pg12/lib/postgresql/pg_show_plans.so' /opt/local/bin/ginstall -c -m 644 .//pg_show_plans.control '/Users/hs/pg12/share/postgresql/extension/' /opt/local/bin/ginstall -c -m 644 .//pg_show_plans--1.0.sql '/Users/hs/pg12/share/postgresql/extension/' |
If things work properly, the code is now successfully installed.
To activate the module, you have to set shared_preload_libraries in postgresql.conf:
|
1 2 3 4 5 |
test=# SHOW shared_preload_libraries; shared_preload_libraries ----------------------------------- pg_stat_statements, pg_show_plans (1 row) |
Once this is done, the extension can be activated in your database:
|
1 2 |
test=# CREATE EXTENSION pg_show_plans; CREATE EXTENSION |
To see how this module works we need two connections: In the first connection I will run a long SQL statement which selects data from a fairly complex system view. To make sure that the query takes forever I have added pg_sleep:
|
1 |
test=# SELECT *, pg_sleep(10000) FROM pg_stats; |
|
1 2 3 4 5 6 7 8 9 10 11 12 13 14 15 16 17 18 19 20 21 22 23 24 25 26 27 28 29 30 |
test=# x Expanded display is on. test=# SELECT * FROM pg_show_plans ; -[ RECORD 1 ]---------------------------------------------------------------------------------------------------- pid | 34871 level | 0 userid | 10 dbid | 26534 plan | Function Scan on pg_show_plans (cost=0.00..10.00 rows=1000 width=56) -[ RECORD 2 ]---------------------------------------------------------------------------------------------------- pid | 34881 level | 0 userid | 10 dbid | 26534 plan | Subquery Scan on pg_stats (cost=129.30..169.05 rows=5 width=405) + | -> Nested Loop Left Join (cost=129.30..168.99 rows=5 width=401) + | -> Hash Join (cost=129.17..167.68 rows=5 width=475) + | Hash Cond: ((s.starelid = c.oid) AND (s.staattnum = a.attnum)) + | -> Seq Scan on pg_statistic s (cost=0.00..34.23 rows=423 width=349) + | -> Hash (cost=114.40..114.40 rows=985 width=142) + | -> Hash Join (cost=23.05..114.40 rows=985 width=142) + | Hash Cond: (a.attrelid = c.oid) + | Join Filter: has_column_privilege(c.oid, a.attnum, 'select'::text) + | -> Seq Scan on pg_attribute a (cost=0.00..83.56 rows=2956 width=70) + | Filter: (NOT attisdropped) + | -> Hash (cost=18.02..18.02 rows=402 width=72) + | -> Seq Scan on pg_class c (cost=0.00..18.02 rows=402 width=72) + | Filter: ((NOT relrowsecurity) OR (NOT row_security_active(oid))) + | -> Index Scan using pg_namespace_oid_index on pg_namespace n (cost=0.13..0.18 rows=1 width=68)+ | Index Cond: (oid = c.relnamespace) |
pg_show_plans is going to return information for every database connection. Therefore it is possible to see everything at a glance and you can react even before a slow query has ended. As far as we know, pg_show_plans is the only module capable of providing you with this level of detail.
If you want to know more about execution plans we suggest checking out one of our other posts dealing with index scans, bitmap index scans and alike.
We are looking forward to seeing you on our blog soon for more interesting stuff.
We have https://github.com/postgrespro/pg_query_state for this and more.
Hey Hans!
I really enjoy your articles. I was also reading your book about mastering postgresql 11, but i came across a strange behavior withing PostgreSQL planner. I have a huge table (around 100 million rows), and i'm trying to aggregate some records. It's more of an analytical query, something like
SELECT cab.id_consumer,
cab.id_action,
cab.id_subcampaign,
cab.brand,
count(*) AS hits
FROM dimensions.consumer_action_brand cab
GROUP BY cab.id_consumer, cab.id_action, cab.id_subcampaign, cab.brand;
Firstly, the planner gave me a cost of 31779206, with actual time of 200927 ms. It also showed that it does some external merge on the Disk of around 2875752kB. So i increased the work_mem to about 3 GB. After that, the planner gave me a cost of 8847090 (almost 4 times lower), but with an actual time of 236008ms and no more external merge.
I find it quite hard to understand this! Any hint or direction would be much appreciated!
Thank you!
Hello, is it possible to run pg_show_plans on AWS RDS Postgres? I would assume no? Thank you!