By Kevin Speyer - In this post, we will cover a step by step guide on how to implement a clustering algorithm within PostgreSQL. The clustering algorithm is the well-known k-means, which splits data into groups by minimising the sum of the squared distances of each point to the corresponding group average. This method belongs to the so called unsupervised learning algorithms, because it does not require labels to train the model. Instead, the model extracts the underlying structure by observing the distribution of data.
In a previous post we've covered how to execute a python k-means algorithm inside Postgres. In this case, we will use another library written in c, from this repository.
Table of Contents
First, let's clone the repository into our computer:
|
1 2 |
$ git clone git@github.com:cybertec-postgresql/kmeans-postgresql.git $ cd kmeans-postgresql |
Now, we have to install the package:
|
1 |
$ sudo make install |
To test the extension, I will create a new database:
|
1 |
$ createdb kmeans |
Finally, let's run the kmeans.sql script to create the functions in the database. This will allow us to run the k-means algorithm from within the database.
|
1 |
$ psql -f kmeans--1.1.0.sql -U user -d kmeans |
We are done with the setup!
Now, let's test the algorithm. We can use the test data from the repository, which is located in the "data/" directory. We have to create a table to copy the data into:
|
1 |
$ psql -U user -d kmeans |
|
1 2 3 |
kmeans=> CREATE TABLE testdata(val1 float, val2 float, val3 float); kmeans=> \i input/kmeans.source kmeans=> \copy testdata FROM './data/testdata.txt' ( FORMAT CSV, DELIMITER(' ') ) |
Now, we can call the kmeans function from the database and see the results:
|
1 2 3 4 5 6 7 8 9 10 11 12 13 14 |
kmeans=> SELECT kmeans(ARRAY[val1, val2], 5) OVER (), val1, val2 FROM testdata limit 10; kmeans | val1 | val2 --------+-----------+----------- 2 | 1.208985 | 0.421448 3 | 0.504542 | -0.28573 2 | 0.630568 | 1.054712 2 | 1.056364 | 0.601873 0 | 1.095326 | -1.447579 1 | -0.210165 | 0.000284 0 | -0.367151 | -1.255189 0 | 0.868013 | -1.063465 3 | 1.704441 | -0.644833 0 | 0.565619 | -1.637858 (10 rows) |
The last parameter (5 in this case) is the number of clusters to divide the data into. The OVER clause gives us the possibility to perform the clusterization in a window. This can be achieved using PARTITION BY, like this:
|
1 |
kmeans=> SELECT kmeans(ARRAY[val1, val2], 2) OVER (partition by val1 > 0), val1, val2 FROM testdata limit10; |
In this case, the algorithm runs separately for all data with val1 > 0, exactly like a window function.
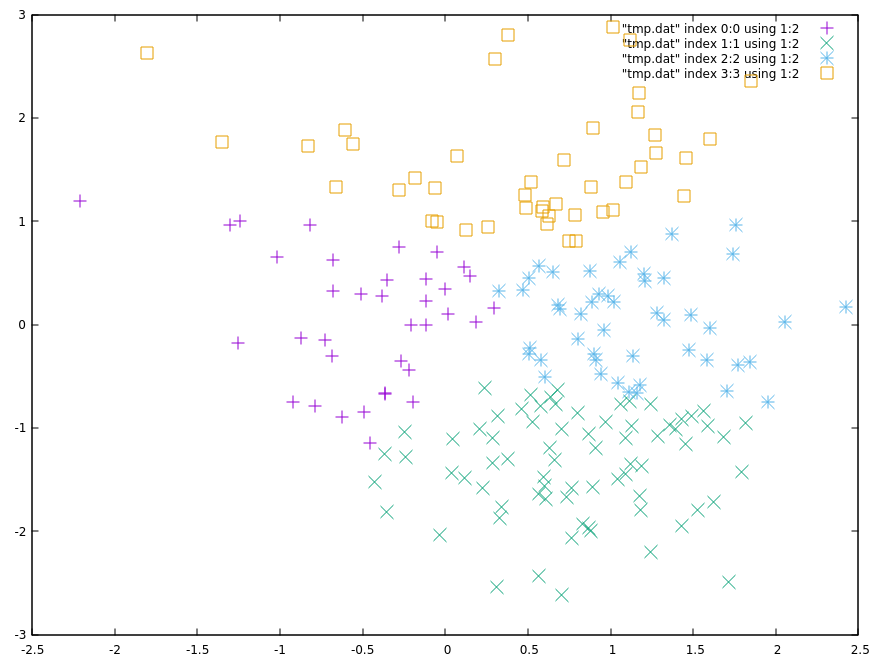
To visualize the results, we can run the perl script in the repository. If you have never used gnuplot, it is necessary to install it first:
|
1 |
$ sudo dnf install -y gnuplot |
or for APT package manager
|
1 |
$ sudo apt-get install -y gnuplot |
Lastly, run the plot script and observe the results!
|
1 |
perl plot-cybertec.pl -d kmeans -k 4 |
The output of the script is displayed: the algorithm divides the data into four clusters

If you are not working on a local machine, or just want to look at the plot in the terminal, you can add the -t option:
|
1 |
perl plot-cybertec.pl -d kmeans -k 4 -t |
And you should see something like this in the terminal:
|
1 2 3 4 5 6 7 8 9 10 11 12 13 14 15 16 17 18 19 20 21 |
3 +-++---+--+---+--+--+---D--+---++-+ + + D + + + + DD +D + + + "tmp.dat" index 0:0 using 1:2 A | D D | "tmp.dat" index 1:1 using 1:2 B 2 +-+ D D +-+ "tmp.dat" index 2:2 using 1:2 C | D D D D D DDD | "tmp.dat" index 3:3 using 1:2 D | D DDD D DDD | 1 +-A AA A DD DDDDD D C +-+ | A A ADD D CC C | | A AAAACCC CCCC | 0 +-+ A AAAA CCC CC C+-C | A AA A C CCCC CC | | AA B C CCC CCC | | AAAAAA BBBB BB BBCC | -1 +-+ AB BBB BBBBBBBBB +-+ | BB BBBBBBBBB B | | B B BB B BB | -2 +-+ B BB B B +-+ | B B | + + + + + + B+ B + + + + -3 +-++---+--+---+--+--+---+--+---++-+ -2.5-2 -1.5-1 -0.5 0 0.5 1 1.5 2 2.5 |

You need to load content from reCAPTCHA to submit the form. Please note that doing so will share data with third-party providers.
More InformationYou are currently viewing a placeholder content from Facebook. To access the actual content, click the button below. Please note that doing so will share data with third-party providers.
More InformationYou are currently viewing a placeholder content from X. To access the actual content, click the button below. Please note that doing so will share data with third-party providers.
More Information
git clone git@github.com:cybertec-postgresql/kmeans-postgresql.git
Cloning into 'kmeans-postgresql'...
git@github.com: Permission denied (publickey).
fatal: Could not read from remote repository.
Please make sure you have the correct access rights
and the repository exists.
Please let me know how to clone your git.