PostgreSQL replication (synchronous and asynchronous replication) is one of the most widespread features in the database community. Nowadays, people are building high-availability clusters or use replication to create read-only replicas to spread out the workload. What is important to note here is that if you are using replication, you must make sure that your clusters are properly monitored.
The purpose of this post is to explain some of the fundamentals, to make sure that your PostgreSQL clusters stay healthy.
Table of Contents
The best way to monitor replication is to use pg_stat_replication, which contains a lot of vital information. Here is what the view looks like:
|
1 2 3 4 5 6 7 8 9 10 11 12 13 14 15 16 17 18 19 20 21 22 23 24 |
test=# \d pg_stat_replication View 'pg_catalog.pg_stat_replication' Column | Type | Collation | Nullable | Default -----------------+-------------------------+-----------+----------+--------- pid | integer | | | usesysid | oid | | | usename | name | | | application_name | text | | | client_addr | inet | | | client_hostname | text | | | client_port | integer | | | backend_start | timestamp with time zone| | | backend_xmin | xid | | | state | text | | | sent_lsn | pg_lsn | | | write_lsn | pg_lsn | | | flush_lsn | pg_lsn | | | replay_lsn | pg_lsn | | | write_lag | interval | | | flush_lag | interval | | | replay_lag | interval | | | sync_priority | integer | | | sync_state | text | | | reply_time | timestamp with time zone| | | |
The number of columns in this view has grown substantially over the years. However, let’s discuss some fundamentals first.
People often say that pg_stat_replication is on the “primary”. That’s not quite true. What the view does is to expose information about the wal_sender process. In other words: if you are running cascaded replication, it means that a secondary might also show entries in case it replicates to further slaves. Here is an image illustrating the situation:
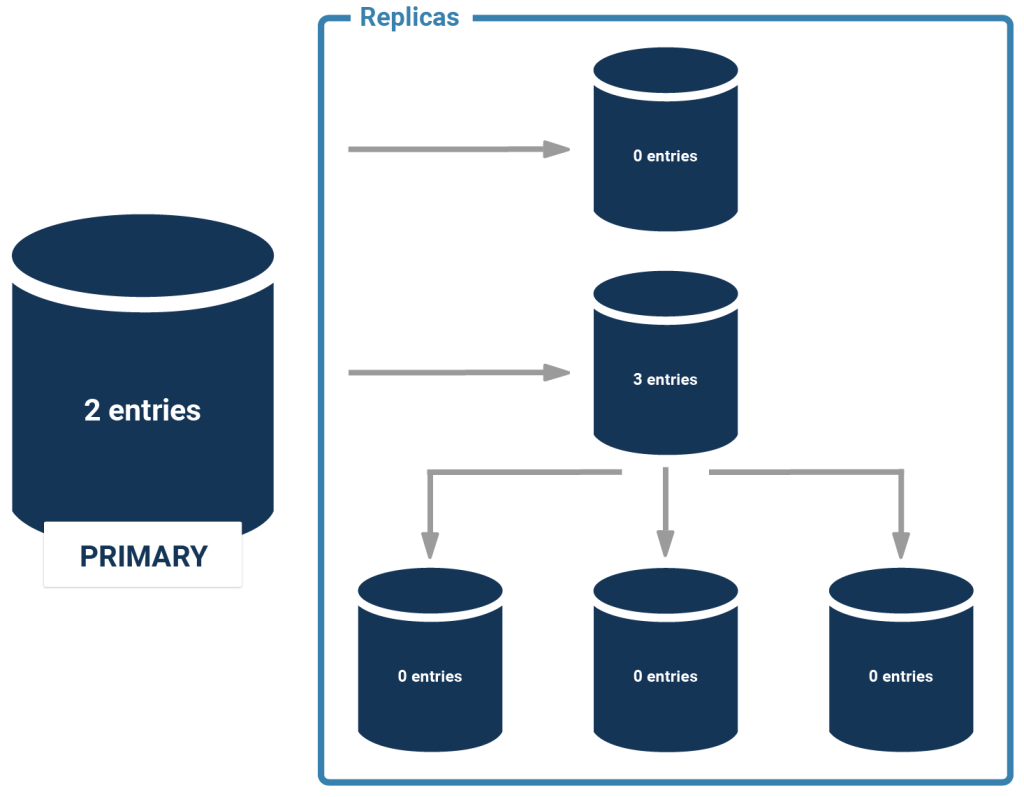
For every WAL sender process you will get exactly one entry. What is important is that each server is only going to see the next ones in the chain - a sending server is never going to see “through” a slave. In other words: In the case of cascading replication, you have to ask every sending server to get an overview.
But there’s more: often people have to determine if a slave is up to date or not. There are various things which are relevant here:
The following picture illustrates those fields:
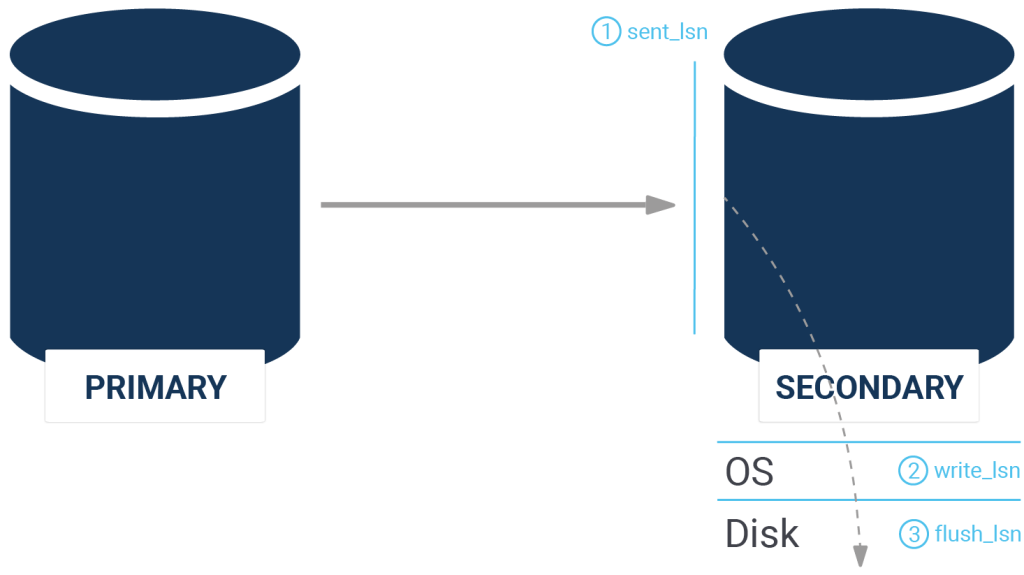
What’s important to note here is that PostgreSQL offers a special data type to represent this data: pg_lsn
One can figure out the current WAL position easily. Here is how it works:
|
1 2 3 4 5 |
test=# SELECT pg_current_wal_lsn(); pg_current_wal_lsn -------------------- 3/DA06D240 (1 row) |
What’s noteworthy here is that it’s possible to make calculations:
|
1 2 3 4 5 |
test=# SELECT pg_current_wal_lsn() - '3/B549A845'::pg_lsn; ?column? ----------- 616376827 (1 row) |
PostgreSQL provides various operators to do such calculations. In other words: it’s easy to figure out how far a replica has fallen behind.
People keep asking us what the difference between the flush_lsn and the replay_lsn might be. Well, let’s dig in and find out: when WAL is flowing from the master to the slave, it is first sent over the network, then sent to the operating system and finally transactions are flushed to disk to assure durability (= crash safety). The flush_lsn obviously represents the last WAL position flushed to disk. The question now is: is data visible as soon as it is flushed? The answer is: no, there might be replication conflicts as described in one of our older blog posts. In case of a replication conflict, the WAL is persisted on the replica - but it is only replayed when the conflict is resolved. In other words, it might happen that data is stored on the slave which is not yet replayed and thus accessible by end users.
This is important to note, because replication conflicts occur more often than you might think. If you see a message as follows, you have hit a replication conflict:
|
1 2 |
ERROR: canceling statement due to conflict with recovery DETAIL: User query might have needed to see row versions that must be removed. |
Sometimes it’s necessary to determine the amount of replication lag in seconds. So far, we have seen the distance between two servers in bytes. If you want to measure the lag, you can take a look at the _lag columns. The data type of those columns is “interval” so you can see what the delay is in seconds or even minutes. If replication is working properly, the lag is usually very very small (milliseconds). However, you might want to monitor that.
A word of caution: if you are running large scale imports such as VACUUM or some other expensive operations, it might easily happen that the disk throughput is higher than the network bandwidth. In this case, it is possible and quite likely that the slave falls behind. You have to tolerate that and make sure that alerting does not kick in too early.
To monitor replication, you can rely on the manual magic I have just shown. However, there is also a lot of ready-made tooling out there to facilitate this task. One of the things we can recommend is pgwatch2, which can be downloaded for free as a container.
If you want to check out a demo showing how pgwatch works, consider checking out our pgwatch2 website.
If you want to learn more about PostgreSQL in general we recommend to check out some of our other posts. In case you are interested in storage you may want to take a look at one of our posts about pgsqueeze.
Leave a Reply