Last time I announced we would check out MobilityDB to improve our approach to extract overlapping passage times of healthy and infected individuals – here we go!
Table of Contents
MobilityDB itself is a PostgreSQL extension built on top of PostGIS, specializing on processing and analysing spatio-temporal data. To do so, the extension adds a bunch of types and functions on top of PostGIS to solve different kinds of spatial-temporal questions.
Please check out Documentation (mobilitydb.com) to get an impression of what you can expect here.
The extension is currently available for PostgreSQL 11, PostGIS 2.5 as v1.0-beta version, whereby I understood from the announcements that we can definitely expect a first version to be released in early 2020. To quick start, I definitely recommend using their docker container codewit/mobility.
The blog-post is structured as follows:
As reminder, table mobile_points is a relic of our first blog-post and contains points of individuals. This table and its contents will be used to set up trajectories forming our trips. Table mobile_trips represent trips of individuals, whereas trips are modelled as trajectories utilizing MobilityDB’s tgeompoints data type. Instances of traj are generated from trip’s geometry and subsequently used for visualization.
|
1 2 3 4 5 6 7 8 9 10 11 12 13 |
create table if not exists mobile_points ( gid serial not null constraint mobile_points_ok primary key, customer_id integer, geom geometry(Point,31286), infected boolean, recorded timestamp ); create index if not exists mobile_points_geom_idx on mobile_points using gist (geom); |
|
1 2 3 4 5 6 7 8 9 10 11 12 13 14 15 16 17 18 |
CREATE TABLE public.mobile_trips ( gid serial not null constraint mobile_trips_ok primary key, customer_id integer NOT NULL, trip public.tgeompoint, infected boolean, traj public.geometry ); create index if not exists mobile_trip_geom_idx on mobile_trips using gist (traj); create index if not exists mobile_trip_traj_idx on mobile_trips using gist (trip); create unique index if not exists mobile_tracks_customer_id_uindex on mobile_trips (customer_id); |
Let’s start by generating trips out of points:
|
1 2 3 4 5 6 7 |
INSERT INTO mobile_trips(customerid, trip, traj, infected) SELECT customer_id, tgeompointseq(array_agg(tgeompointinst(geom, recorded) order by recorded)), trajectory(tgeompointseq(array_agg(tgeompointinst(geom, recorded) order by recorded))) infected FROM mobile_points GROUP BY customer_id, infected; |
For each customer, a trip as sequence of instants of tgeompoint is generated. tgeompoint acts as continuous, temporal type introduced by MobilityDB. A sequence of tgeompoint interpolates spatio-temporally between our fulcrums. Here I would like to refer to MobilityDB’s documentation with emphasis on temporal types to dig deeper.
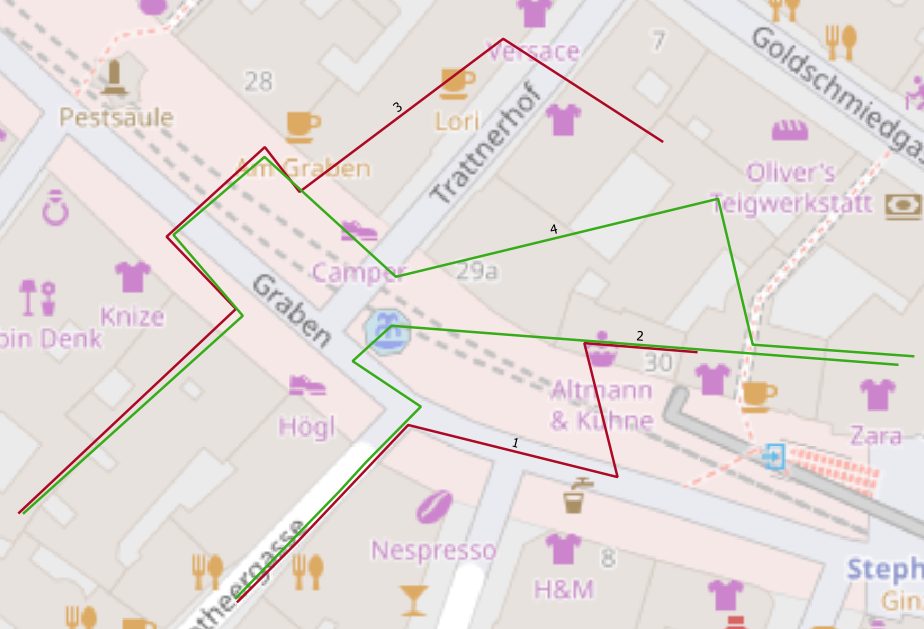
Figure 1 shows, not surprisingly, a visualization of resulting trip geometries (traj).
Let’s start with our analysis and identify spatio-temporally overlapping segments of individuals. The following query returns overlapping segments (within 2 meters) by customer pairs represented as geometries.
|
1 2 3 4 5 6 7 8 9 10 11 12 |
SELECT T1.customer_id AS customer_1, T2.customer_id AS customer_2, getvalues( atPeriodSet(T1.Trip, getTime(atValue(tdwithin(T1.Trip, T2.Trip, 2), TRUE)))) FROM mobile_trips T1, mobile_trips T2 WHERE t1.customer_id < t2.customer_id AND t1.infected <> t2.infected AND T1.Trip && expandSpatial(T2.Trip, 2) AND atPeriodSet(T1.Trip, getTime(atValue(tdwithin(T1.Trip, T2.Trip, 2), TRUE))) IS NOT NULL ORDER BY T1.customer_id, T2.customer_id |
To do so and to utilize spatio-temporal indexes on trips, expanded bounding-boxes are intersected first.
|
1 |
atPeriodSet(T1.Trip, getTime(atValue(tdwithin(T1.Trip, T2.Trip, 2), TRUE))) IS NOT NULL |
getTime returns a detailed temporal profile of overlapping sections as set of periods constrained by tdwithin. A period is hereby a custom type introduced by MobilityDB, which is a customized version of tstzrange. Subsequently to extract intersecting spatial segments of our trip only, periodset restricts our trip by utilizing atPeriodSet. Finally, getValues extracts geometries out of tgeompoint returned by atPeriodSet.
But we’re not done. Multiple disjoint trip segments result in multi-geometries (Figure 2, 2 disjoint segments for customer 1 and 2). To extract passage times by disjoint segment and customer, multi-geometries must be “splitted up” first. This action can be carried out utilizing st_dump. To extract passage times for resulting simple, disjoint geometries, periods of periodset must be related accordingly.
First we turn our periodset into an array of periods. Next, we flatten the array utilizing unnest.
In the end, we call timespan on periods to gather passage times by disjoint segment.
|
1 2 3 4 5 6 7 8 9 10 11 12 13 14 15 16 17 |
SELECT T1.customer_id AS customer_1, T2.customer_id AS customer_2, (st_dump( getvalues( atPeriodSet(T1.Trip, getTime(atValue(tdwithin(T1.Trip, T2.Trip, 2), TRUE)))))).geom, extract('epoch' from timespan( unnest( periods(getTime(atValue(tdwithin(T1.Trip, T2.Trip, 2), TRUE)))))) FROM mobile_trips T1, mobile_trips T2 WHERE t1.customer_id < t2.customer_id AND t1.infected <> t2.infected AND T1.Trip && expandSpatial(T2.Trip, 2) AND atPeriodSet(T1.Trip, getTime(atValue(tdwithin(T1.Trip, T2.Trip, 2), TRUE))) IS NOT NULL ORDER BY T1.customer_id, T2.customer_id |
Please find attached to the end of the article an even more elegant, improved way to extract passage times by disjoint trip segment utilizing MobilityDB’s functions only.
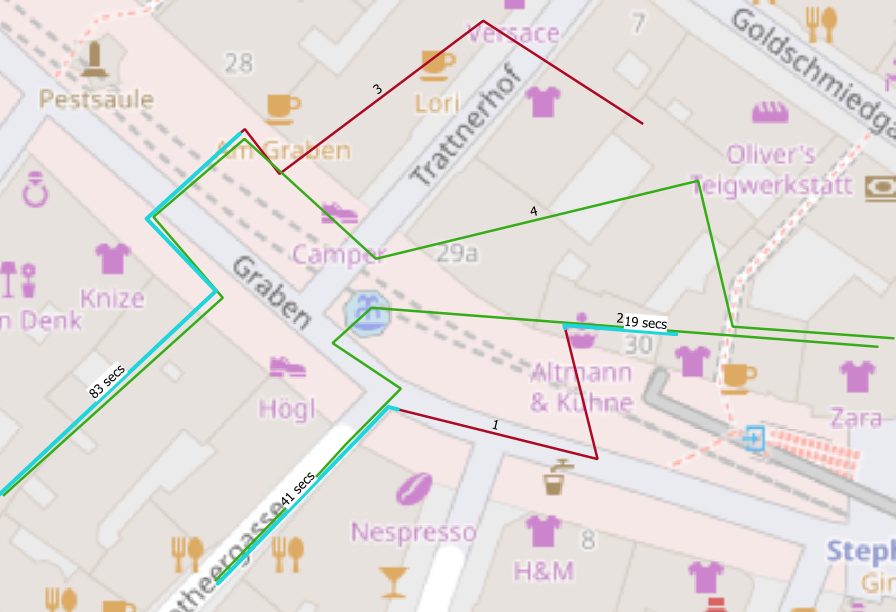
The image below now shows results for both queries by highlighting segments of contact for our individuals in blue, labelled by its passage times.
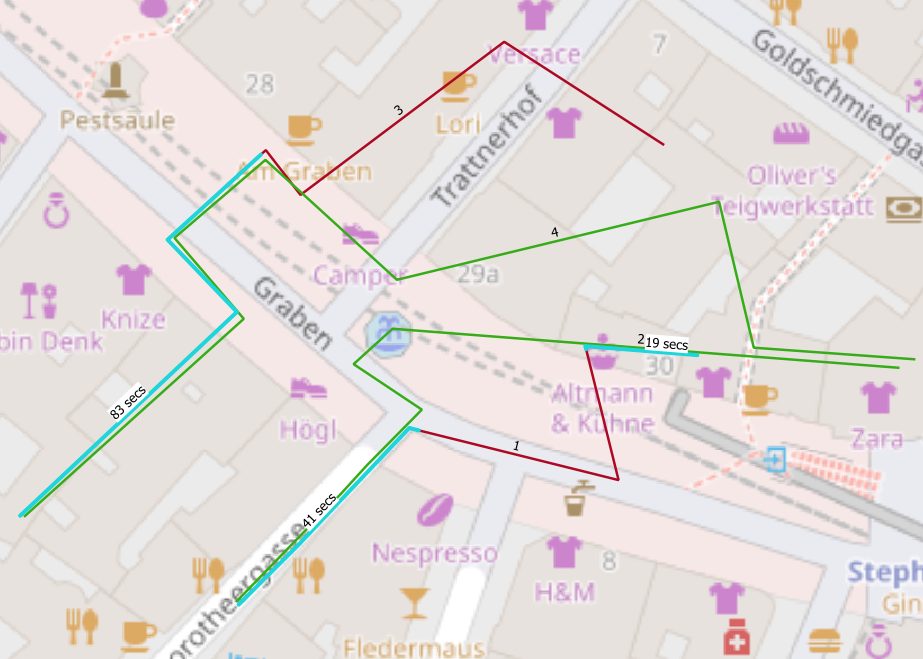
So far so good – results correspond with our initial approach from my last blogpost.
Remember what I mentioned in the beginning regarding interpolation?
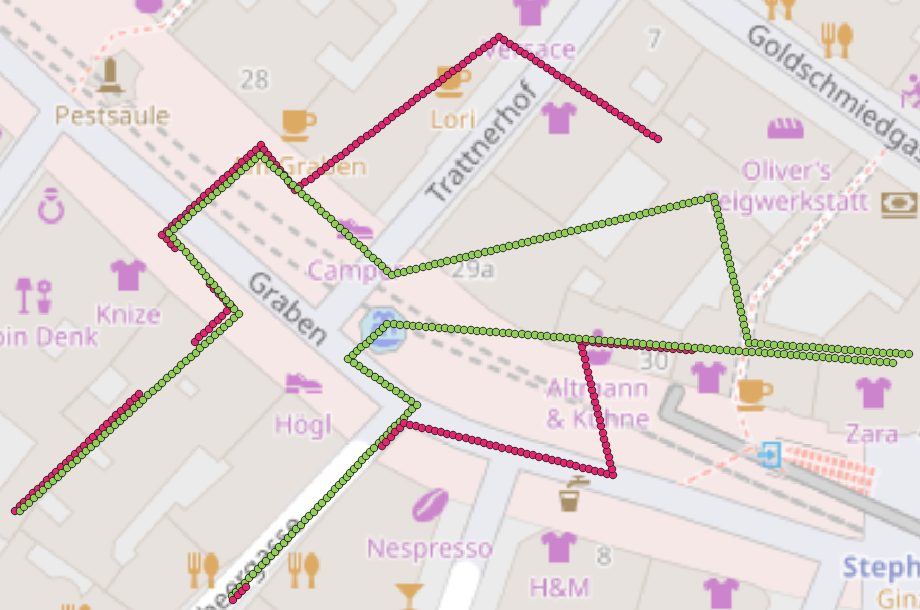
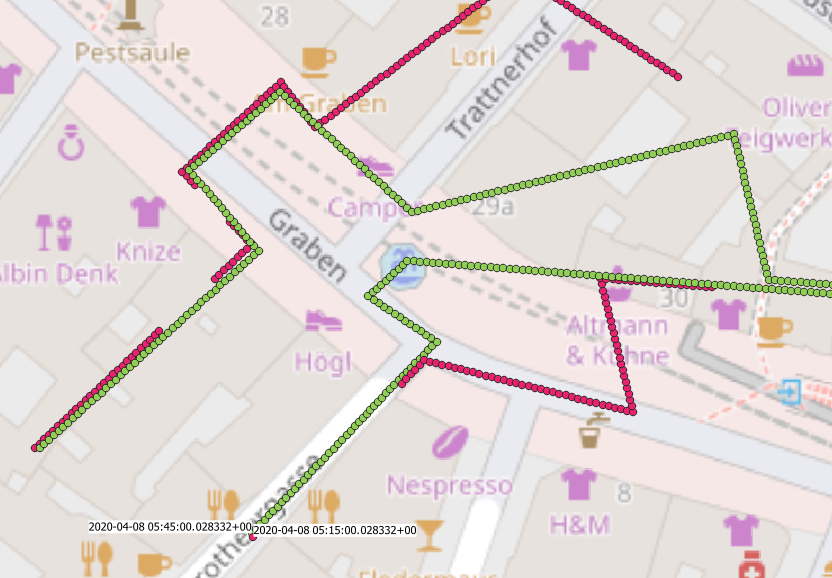
Figure 3 represents our generalized sequence of points, Figure 4 presents resulting trips, whose visualization already indicates that interpolation between points worked as expected. So even though we removed a bunch of fulcrums, resulting passage times correspond with our initial assessment (see figure 5).
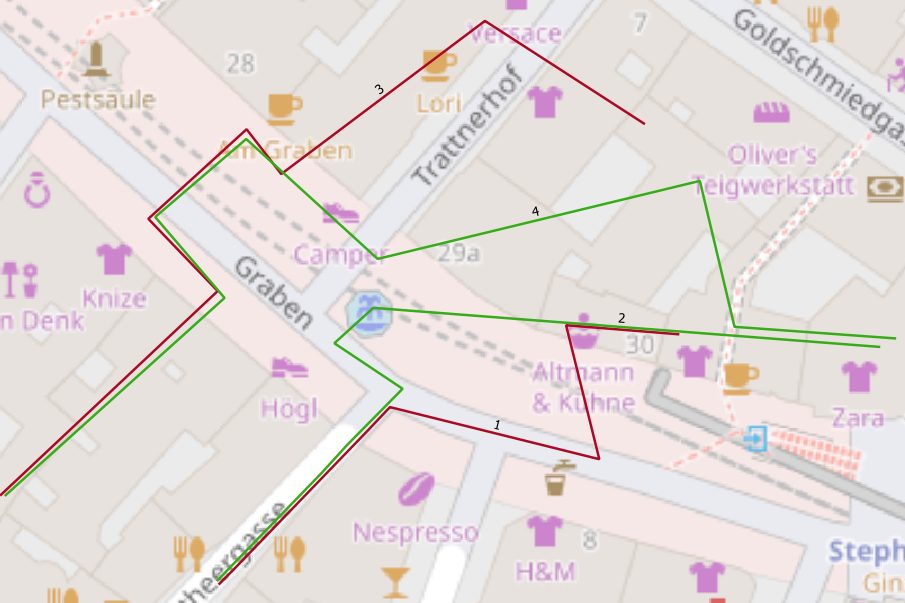
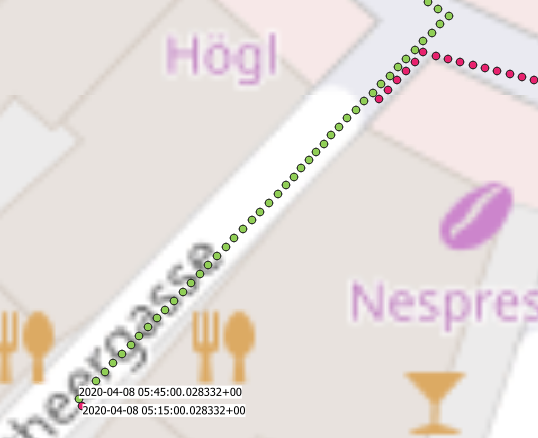
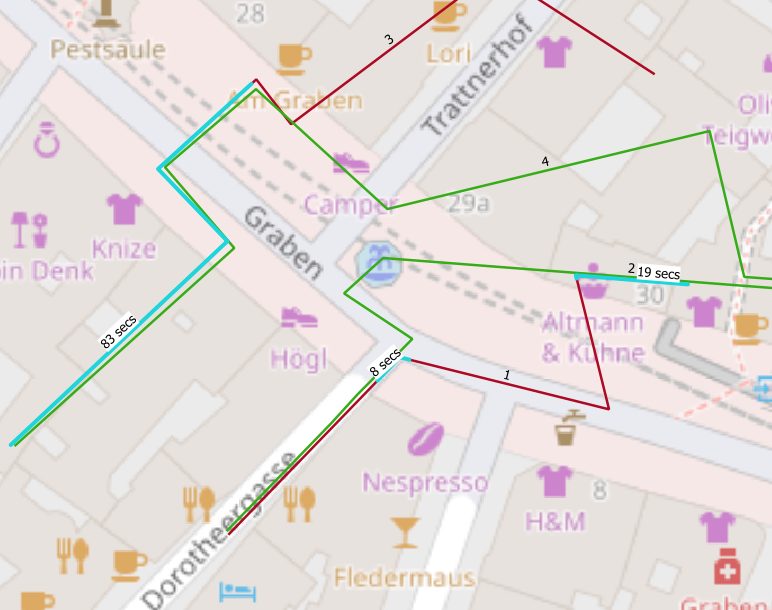
and change the customers' speeds by the manipulation point’s timestamps in the beginning of one of ours trips only (figure 6 and 7). Figure 8 gives an impression, how this affects our results.
I just scratched the surface to showcase MobilityDB’s capabilities, but hopefully I made you curious enough to take a look by yourselves.
I (to be honest), already have felt in love with this extension and definitely will continue exploring.
Big respect for this great extension and special thanks goes to Esteban Zimanyi and Mahmoud Sakr, both main contributors, for their support!
|
1 2 3 4 5 6 7 8 9 10 11 12 13 14 15 16 17 18 19 |
SELECT T1.customer_id AS customer_1, T2.customer_id AS customer_2, trajectory( unnest( sequences( atPeriodSet(T1.Trip, getTime(atValue(tdwithin(T1.Trip, T2.Trip, 2), TRUE)))))), extract('epoch' from timespan( unnest( sequences( atPeriodSet(T1.Trip, getTime(atValue(tdwithin(T1.Trip, T2.Trip, 2), TRUE))))))) FROM mobile_trips T1, mobile_trips T2 WHERE t1.customer_id < t2.customer_id AND t1.infected <> t2.infected AND T1.Trip && expandSpatial(T2.Trip, 2) AND atPeriodSet(T1.Trip, getTime(atValue(tdwithin(T1.Trip, T2.Trip, 2), TRUE))) IS NOT NULL ORDER BY T1.customer_id, T2.customer_id |
Check out my other GIS posts:
You may also be interested in free OpenStreetMap data:
In order to receive regular updates on important changes in PostgreSQL, subscribe to our newsletter, or follow us on Facebook or LinkedIn.
Hi, I have a question.
By TDWITHIN you define a third parameter used as a distance threshold. But, how tdwithin considere time span?
Thank you