When it comes to performance, people tend to forget some basic topics entirely. One of those topics is the impact of writing log files. No, in a typical OLTP workload the creation of log files is definitely not free (in terms of performance). Quite the opposite - having to write millions of lines into a logfile is horribly expensive and can have serious impacts on performance.
Table of Contents
For this test we have used our standard box to do benchmarks again: 8 x 4 GHz AMD, 16 GB RAM, Samsung 840 SSD, pgbench with scale factor 100 = 10 mio rows).
The first test scenario is a fairly straight forward one: We only want to log errors (log_statement = none). This translates to no logging, given the fact that pgbench won't produce errors.
The remaining postgresql.conf settings are as follows:
|
1 2 3 4 |
max_connections = 100 shared_buffers = '2 GB' logging_collector = on log_line_prefix = '[%t / %d / %u] - ' |
Running the test works like this:
|
1 |
pgbench -S -j $CONNS -M prepared -T $T $DB -c $CONNS |
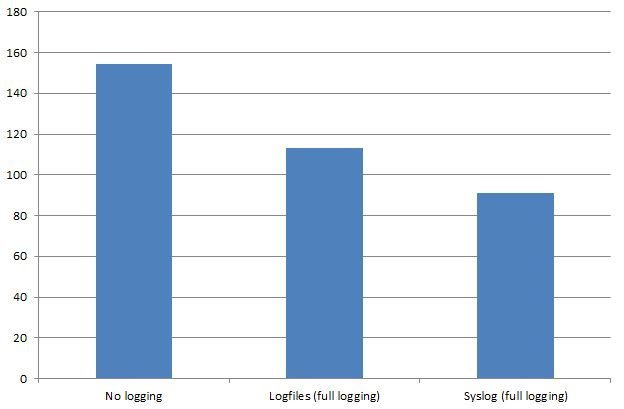
We are using 32 concurrent clients and run the test for 20 minutes. The results are the same as the ones we have already observed in previous tests. We get an average of 154.407 transactions per second (reads).
Let us do a small change now and change log_statement from “none” to “all”.
The drop in performance is highly significant. The transaction count drops to 113.000 per second. This is a highly significant drop. Actually the drop is a little less than I expected but it is still significant.
Finally we wanted to see how syslog behaves. The first thing we noticed was that during the first test run the entire server rebooted after around 30 seconds. The same happened on the second test run. Again, we died after around 30 seconds.
Logically I wanted to see what causes the failure. I started top and ran the test again. This time the benchmark executed nicely. Syslog ate up 85% of one CPU core and memory consumption was pretty stable at around 243 MB. The transaction count showed 91.325 transactions per second.
Interesting: With “top” active, the server survived all tests. It seems top contributes significantly to stability 😉
Seriously: We got to inspect what made syslog fail.
No logging: 154.407
Logfiles (full logging): 113.000
Syslog (full logging): 91.325
+43 (0) 2622 93022-0
office@cybertec.at
You are currently viewing a placeholder content from Facebook. To access the actual content, click the button below. Please note that doing so will share data with third-party providers.
More InformationYou are currently viewing a placeholder content from X. To access the actual content, click the button below. Please note that doing so will share data with third-party providers.
More Information
Leave a Reply