By Kaarel Moppel - I could make good use of the "slow time" around the turn of the year and managed to push out another set of features for our Open Source PostgreSQL monitoring tool called pgwatch2 - so a quick overview on changes in this post. Continuing the tradition, I'm calling it "Feature Pack 4" as it's mostly about new features. Git and Docker images carry version number 1.5.0. As our last pgwatch2-related blogpost covered only 1.4.0, I'll include here also most important stuff from 1.4.5 minor feature release.
Table of Contents
This is the biggest one this time – finally and quite appropriately for "Postgres-minded" people, there's now a chance to store all the gathered metrics in Postgres! This of course doesn't necessarily mean that Postgres is best for storing Time-Series Data although it performs very nicely thanks to JSONB...but in general it's a good compromise – more disk space (~3-4x) at comparable query times to InfluxDB...but with full power of SQL! Meaning some saved time learning a new (and quite limited) query language. And after all, only a few people are running dozens and dozens of databases, so performance is mostly not an issue. And on the plus side we can now ask questions that were previously plainly not possible (no joins, remember) or were only possible by storing some extra columns of data (de-normalizing).
The new functionality is designed for the latest Postgres version of 11, but as people run all kinds of different versions and might not want to set up a new cluster, there is also a legacy mode, that will cost more IO though. In total there are 4 different "schema modes" so that people could optimize their IO based on needs:
For the partitioned modes there is also automatic "retention management" – by default 1 month of data is kept. Partitions live in a separate "subpartitions" schema, top level tables are in "public".
To test it out fire up a Docker container with something like:
|
1 2 3 |
# assuming 'postgres' is superuser and auto-creating metrics fetching helpers docker run --rm --name pw2 -p 3000:3000 -e PW2_ADHOC_CONN_STR='postgresql://postgres@mydb.com/mydb' -e PW2_ADHOC_CREATE_HELPERS=1 cybertec/pgwatch2-postgres # After 5min open up Grafana at 0.0.0.0:3000 and start evaluating what's going on in your database... |
And as always, please do let us know on GitHub if you’re still missing something in the tool or are experiencing difficulties - any feedback would be highly appreciated!
Project GitHub link – here.
Full changelog – here.
There are multiple (4) storage schema types supported so even legacy PG versions and custom needs should be covered. PG 11+ needed though to use time-based partitioning. Comes with automatic "retention policy" enforcement (given the gatherer is running).
A by-product of testing Postgres metrics storage, it helps to quickly estimate metrics data volumes under real life conditions to see if your hardware or selected storage "schema type" can handle the amount of planned metrics. Metrics will be fetched one time from a user specified DB and then data inserted multiple times with correct intervals for the simulated host count. There are also some scripts provided to generate bigger data amounts faster and to test typical dashboard queries speed.
Previously monitoring user passwords where stored in plain text for both "config DB" and "YAML" mode. Now an encryption key or keyfile can be provided to the Gatherer and the Web UI to transparently encrypt passwords. Default will remain "plain-text" as pgwatch2 is assumable mostly used in safe environments or for ad-hoc troubleshooting and it's just more convenient so.
Previously only 'disabled' and 'require' were supported. Certs need to be present on the machine where the gatherer is running.
For example, the "pg_stat_database_conflicts" view is always empty on a primary, so it makes no sense to query it there. This should result in less errors both in Postgres and pgwatch2 logs.
Previously "public" schema for extensions and "metric fetching helpers" was assumed, but now no such assumption is made, allowing any schema – user just needs to make sure that the monitoring role has it's "search_path" correctly set. Also, no more "public" grants for helpers, only for the monitoring role.
Paths need to be adjusted manually both for the Gatherer and Web UI. Thanks @slardiere!
50% less internal message passing over channels meaning much better performance when monitoring 50+ DB-s.
Also, when metric definitions are not found etc, one error per hour only.
Some new metrics ("wal_size") added and "db_size" split up from "db_stats". Gathering intervals for some "not so used" metrics have also been increased in the preset configs.
Two different metric queries can now run simultaneously on a single monitored DB.
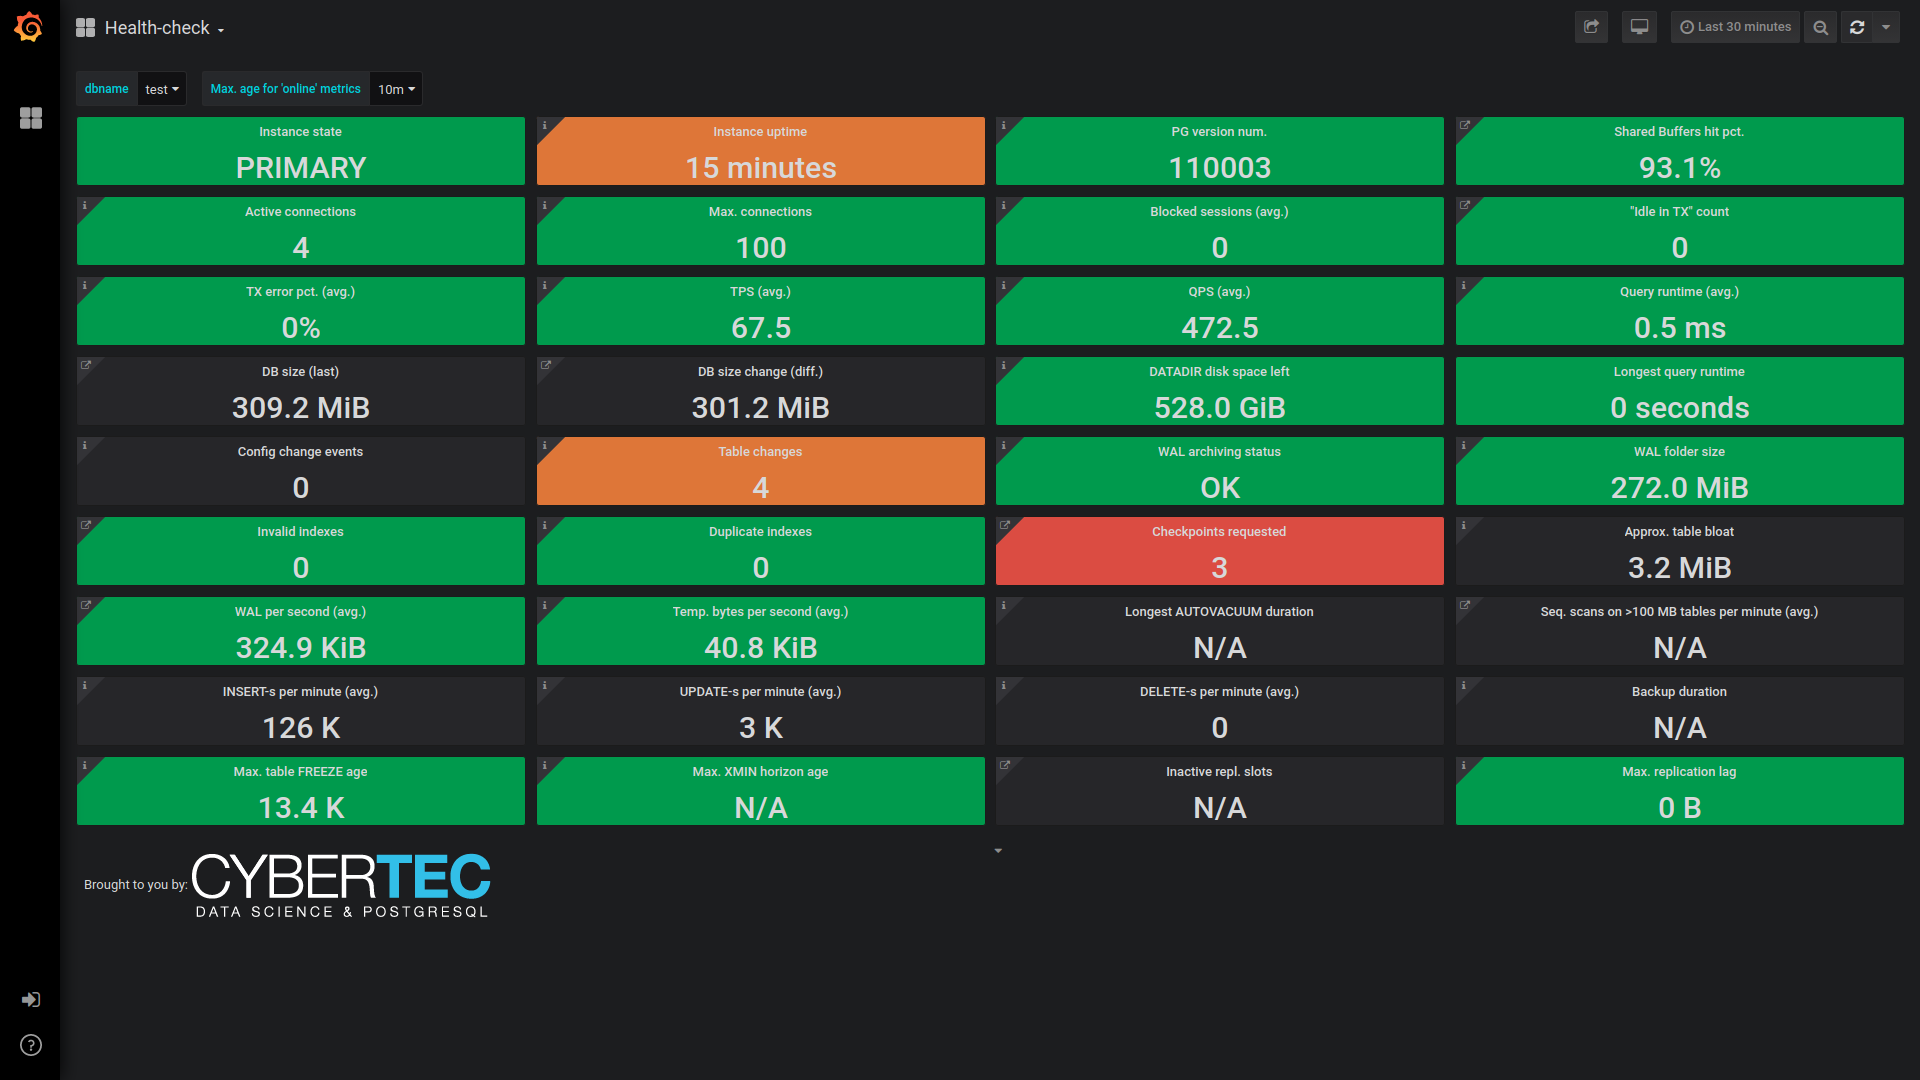
All most important health indicators on a singe page, with green / yellow / red indicators.
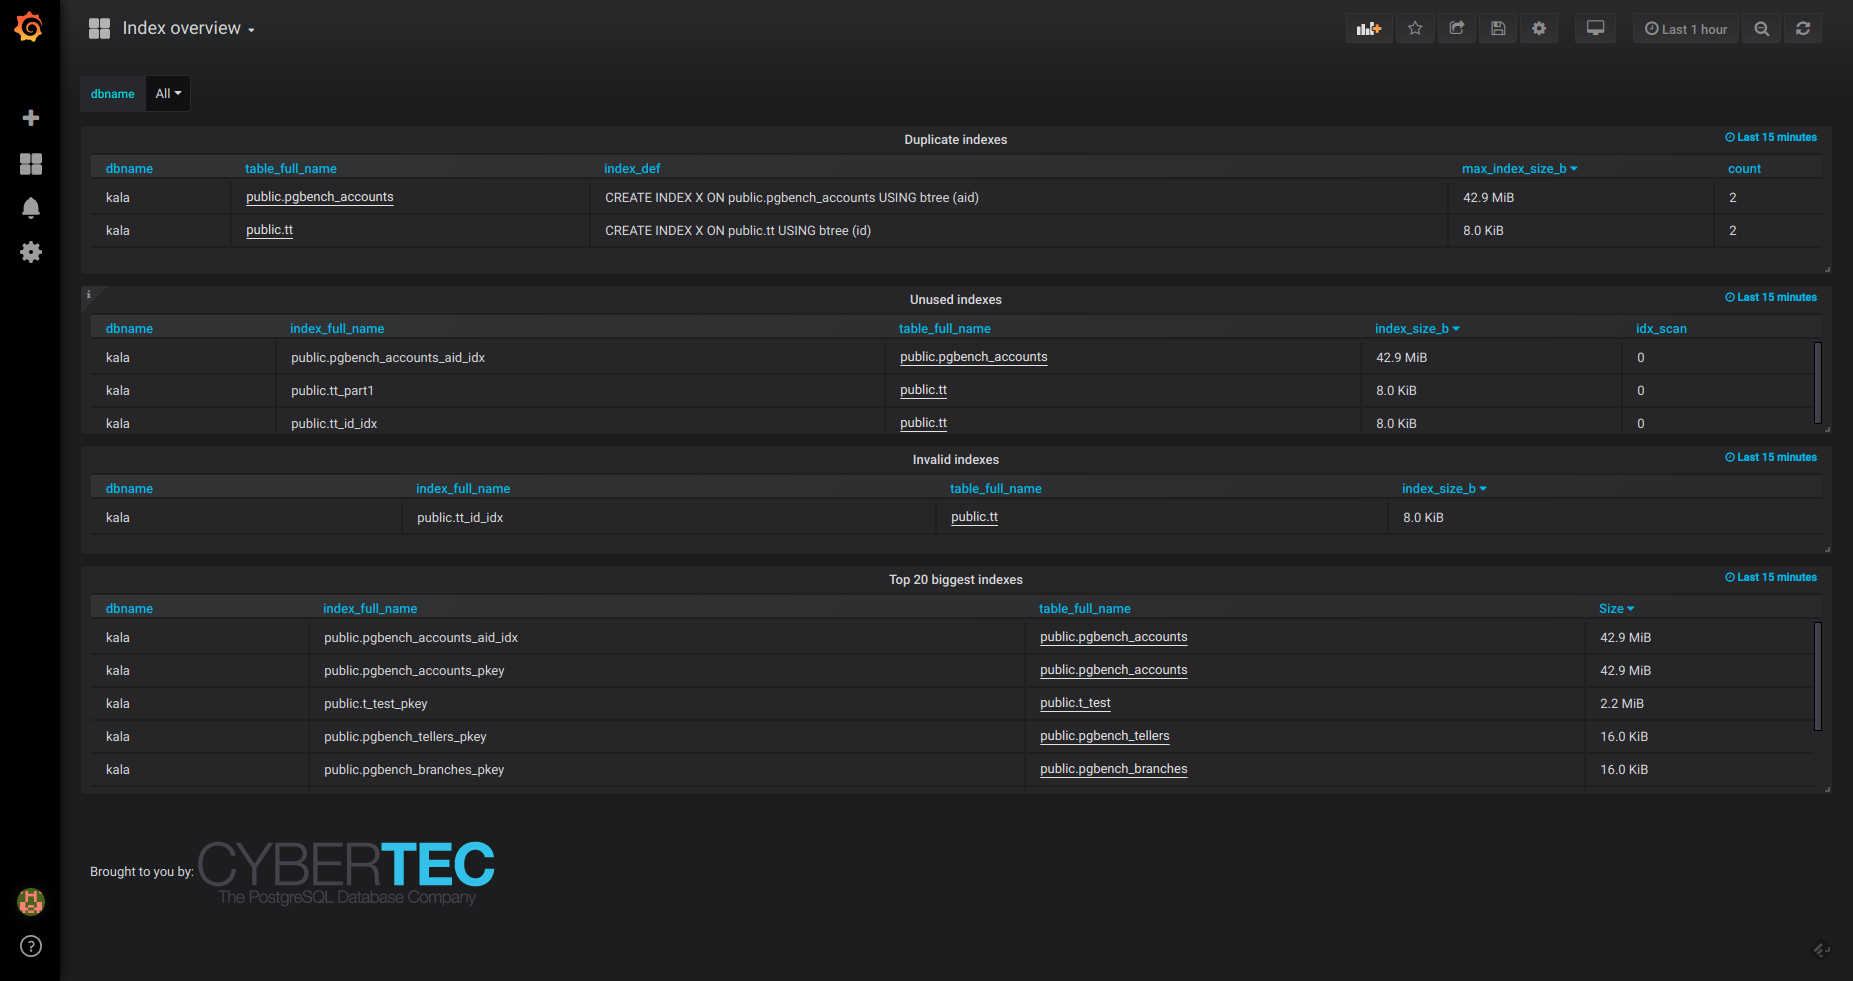
Top scanned, un-used, biggest, duplicate and invalid indexes overview.
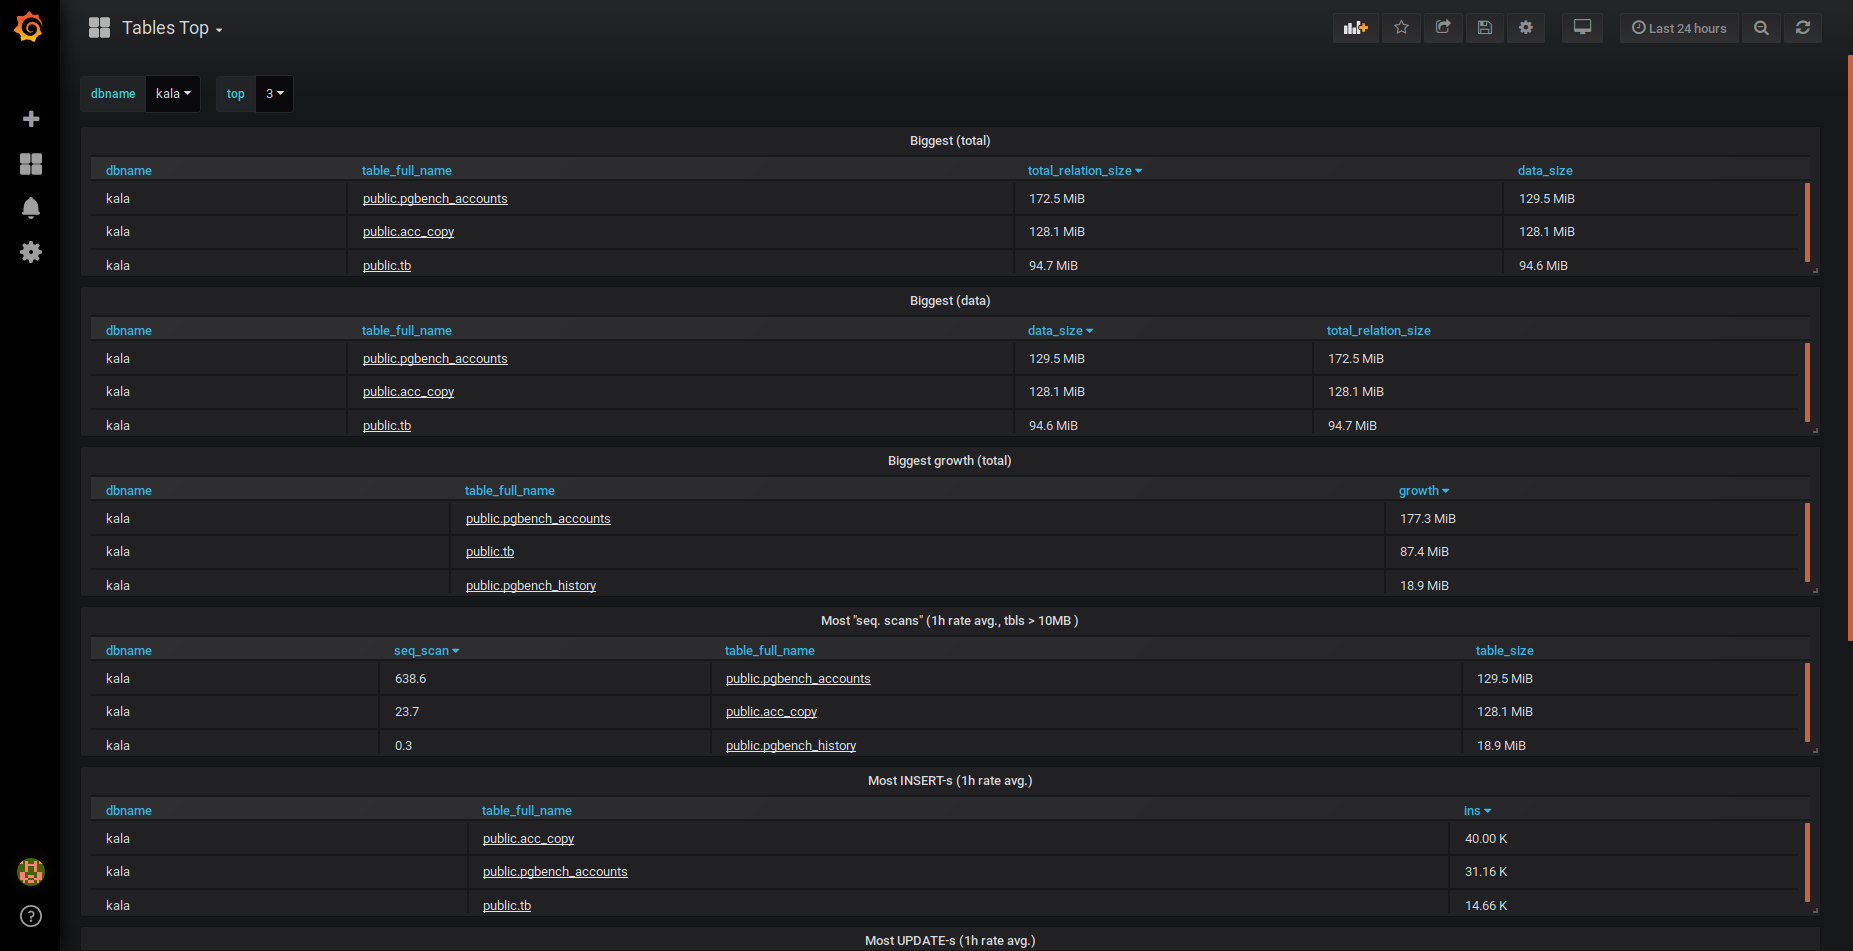
Top-N by size and growth/scan and INSERT/UPDATE/DELETE rates.
pgwatch2 is constantly being improved and new features are added. Learn more >>
"Health-check" dashboard
"Index overview" dashboard
"Top tables" dashboard
+43 (0) 2622 93022-0
office@cybertec.at
You are currently viewing a placeholder content from Facebook. To access the actual content, click the button below. Please note that doing so will share data with third-party providers.
More InformationYou are currently viewing a placeholder content from X. To access the actual content, click the button below. Please note that doing so will share data with third-party providers.
More Information
Hi,
I have installed and configured pgwatch2 on docker. I also configured db set up in http://127.0.0.1:8080/dbs. But on grafana dashobard I get below error.
Templating init failed
pq: syntax error at or near "VALUES.
In Logs->Postgres I got belwo error.
2019-02-18 12:12:36.982 UTC,"postgres","DBname",2342,"127.0.0.1:48264",5c6aa134.926,1,"startup",2019-02-18 12:12:36 UTC,5/1304,0,FATAL,3D000,"database ""DBname"" does not exist",,,,,,,,,""
Could anyone please let me know what I missed?
Hi, if problem persists please open an issue on Github with all the details, including which image you used. Thanks
A debian package would be nice ...
Sadly no concrete plans for that...there's also a quite lonely ticket on that so any help would be appreciated 🙂