R is a free Open Source programming language and statistics package that is excellent for data analysis, statistics and graphics. It has been developed in the 90s and its community has steadily grown over the years. Developers and analysts can use R to analyze data from many different sources including PostgreSQL. This article shows, how an easy R application can be written to visualize data in a trivial PostgreSQL database. For the actual visualization, we have used an extension to R, which is called Shiny. It allows you to write web applications extremely fast using very little code.
Table of Contents
For the sake of simplicity we create a simple table containing just two columns:
|
1 2 3 4 5 6 7 8 9 10 |
test=# CREATE TABLE t_demo ( id serial, data numeric ); CREATE TABLE test=# INSERT INTO t_demo SELECT id, random() FROM generate_series(1, 10) AS id; INSERT 0 10 |
To keep things simple just 10 rows have been added to the table. R does not provide built-in relational database access capabilities. Instead various interfaces are available through the Comprehensive R Archive Network (CRAN). Support for PostgreSQL is already available as well.
Our entire R Shiny application consists of just 3 files: global.R, server.R and ui.R. Here is the content of global.R:
|
1 2 3 4 5 6 7 8 9 10 11 12 13 14 15 16 17 18 19 |
library(RPostgreSQL) library(DT) library(plotly) library(rjson) library(pool) pool <- dbPool( drv = dbDriver('PostgreSQL', max.con = 100), dbname = 'test', host = 'localhost', user = 'hs', password = '123456', idleTimeout = 3600000 ) data_maxmin <- c(round(dbGetQuery(pool, 'SELECT MAX(data), MIN(data) from t_demo;'), 3)) id_maxmin <- c(dbGetQuery(pool, 'SELECT MAX(id), MIN(id) from t_demo;')) |
What happens here is that a couple of R libraries are included into our little program. Then a pooled connection to PostgreSQL is opened. Our program can then use the connection to fetch some data from our simplistic database.
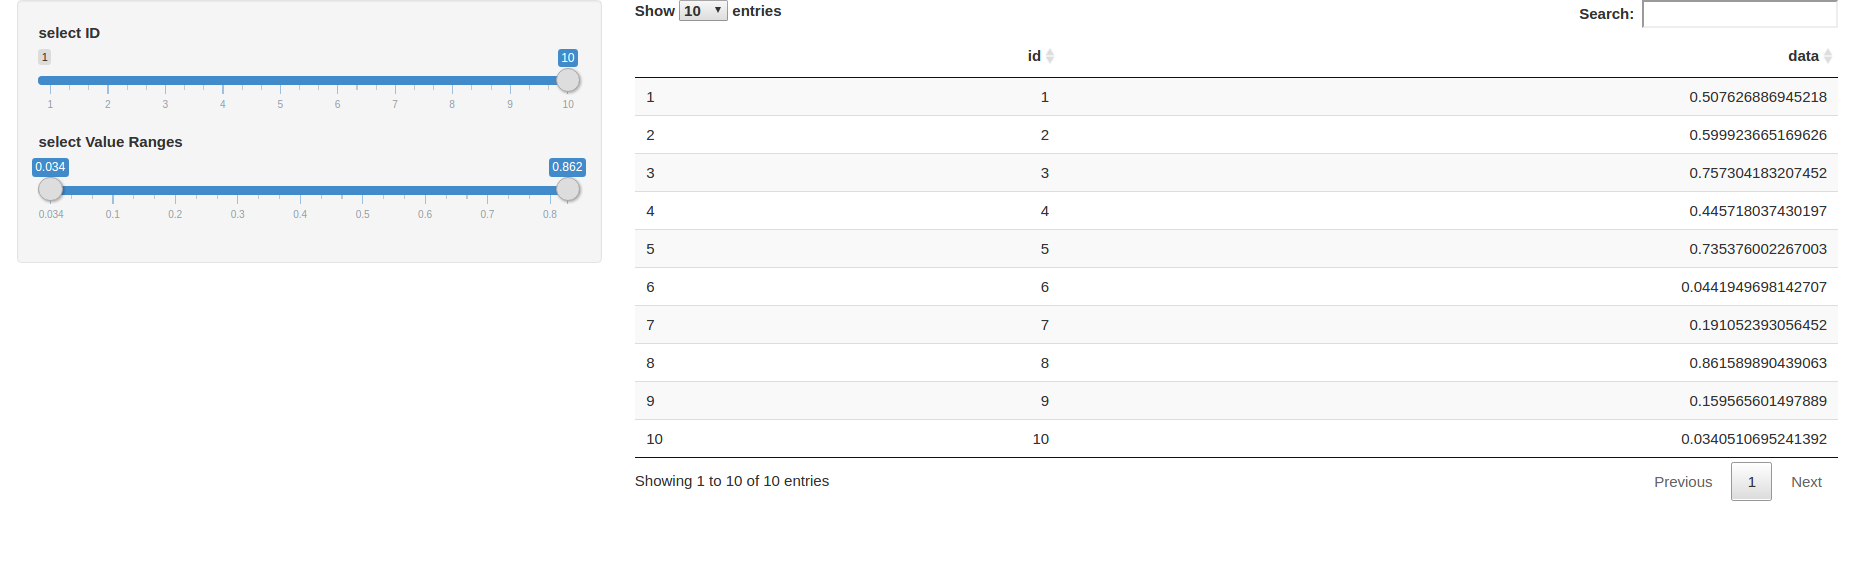
In the next step the user interface (UI) can already be implemented: Again R Shiny offers really simple means to draw the layout. Our page will consist of a main panel and a sidebar, which will hold two input sliders, which are fed by those two SQL queries, you have just seen in global.R.
The goal of our application is to look for data in the database and to apply those filters represented by our sliders.
Here is the content of ui.R:
|
1 2 3 4 5 6 7 8 9 10 11 12 13 14 15 16 17 18 |
fluidPage( sidebarLayout( sidebarPanel( sliderInput('id_selector','select ID', min = id_maxmin$min, max = id_maxmin$max, value = id_maxmin$max, step = 1), sliderInput('value_selector','select Value Ranges', min = data_maxmin$min, max = data_maxmin$max, value = c(data_maxmin$min, data_maxmin$max), step = 0.1) ), mainPanel( DT::dataTableOutput('table') ) ) ) |
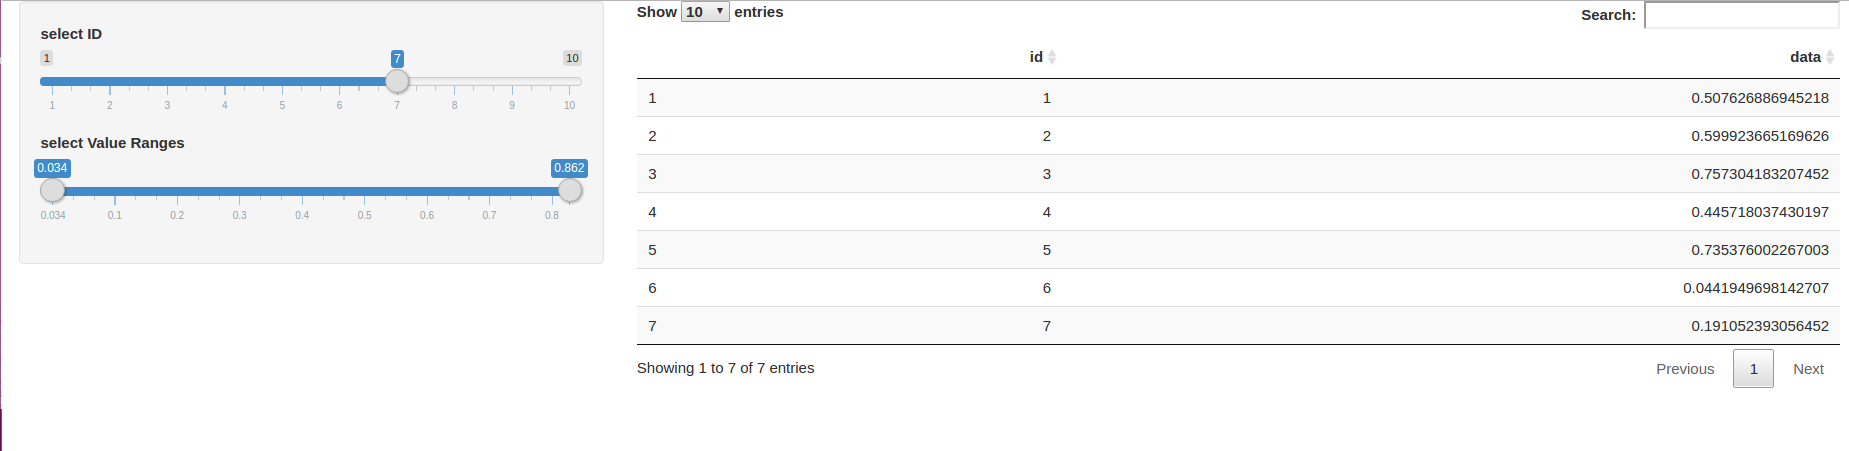
Now that global functions and the GUI are in place, we can turn our attention to server.R, which will contain all the serverside logic to actually create the data displayed in our data table. We run a dynamic SQL statement and feed the output of the SQL directly to the data table, which is really easy to do in R Shiny:
|
1 2 3 4 5 6 7 8 9 10 |
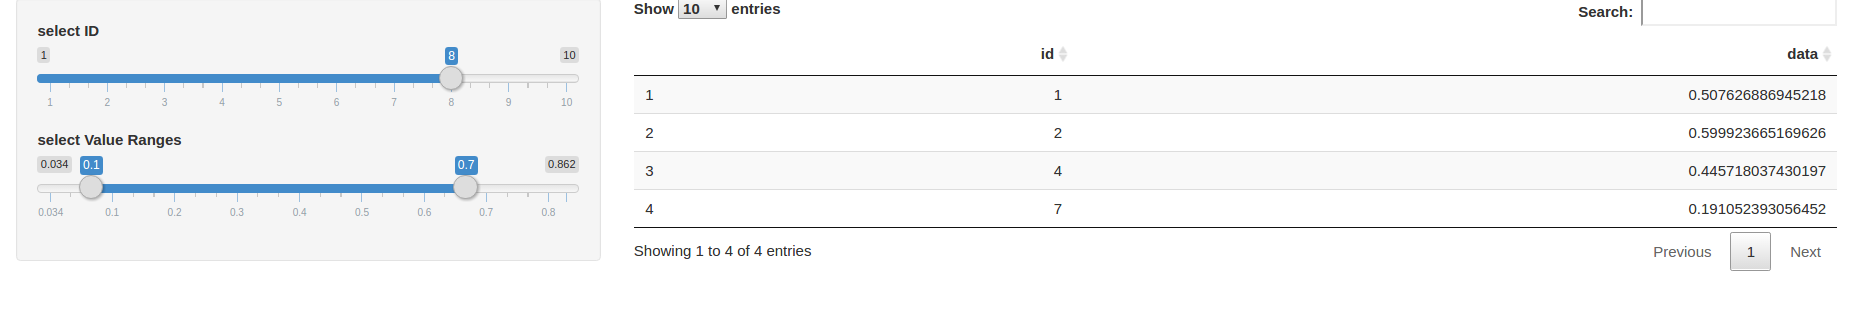
## server side code function(input, output, session) { output$table <- DT::renderDataTable({ query <- sqlInterpolate(ANSI(),'SELECT * from t_demo WHERE id <= ?id AND data BETWEEN ?min and ?max;', id = input$id_selector, min = input$value_selector[1], max = input$value_selector[2]) outp <- dbGetQuery(pool, query) ret <- DT::datatable(outp) return(ret) }) } |
Hacking up a small Shiny application is really easy and running it is not hard either:
|
1 2 3 4 5 6 7 8 9 10 11 12 13 14 |
[hs@zenbook ~]$ R R version 3.4.1 (2017-06-30) -- 'Single Candle' Copyright (C) 2017 The R Foundation for Statistical Computing Platform: x86_64-redhat-linux-gnu (64-bit) … Type 'demo()' for some demos, 'help()' for on-line help, or 'help.start()' for an HTML browser interface to help. Type 'q()' to quit R. > shiny::runApp() Loading required package: shiny |
First we start a simple R shell and call “shiny::runApp”. If all libraries are in place a browser window will open and the application is ready for use. In case libraries are missing, R will error out and you have to install those missing components from CRAN.
Leave a Reply