It's been quite some time since I last wrote about our Open Source PostgreSQL monitoring tool called pgwatch2, but now there's again a reason for it - it got a lot better again! Updates for the pgwatch2 Postgres monitoring tool include multiple new feature updates per requests from users and also some bugfixes. So this is a quick overview of new stuff here.
Table of Contents
First some words about pgwatch2 - it’s our relatively new (released in January) PostgreSQL monitoring tool, aiming to provide a nice balance between features / usability / out-of-the-box experience, concentrating on nice graphs using Grafana. The philosophy behind the software could be formulated as "simple but flexible". Basically, it tries to do the minimum itself and let other existing software components to do the rest. Users can also easily define their own metrics with SQL and graph them however they want. It’s especially good for ad hoc monitoring, as getting started with pgwatch2 is a one-liner thanks to Docker.
Below is a listing of new features so feel free to check out that latest version and let us know on GitHub if you're still missing something in the tool or are having difficulties with something. Any feedback would be highly appreciated!
Project GitHub link - here.
Version 1.2 full changelog - here.
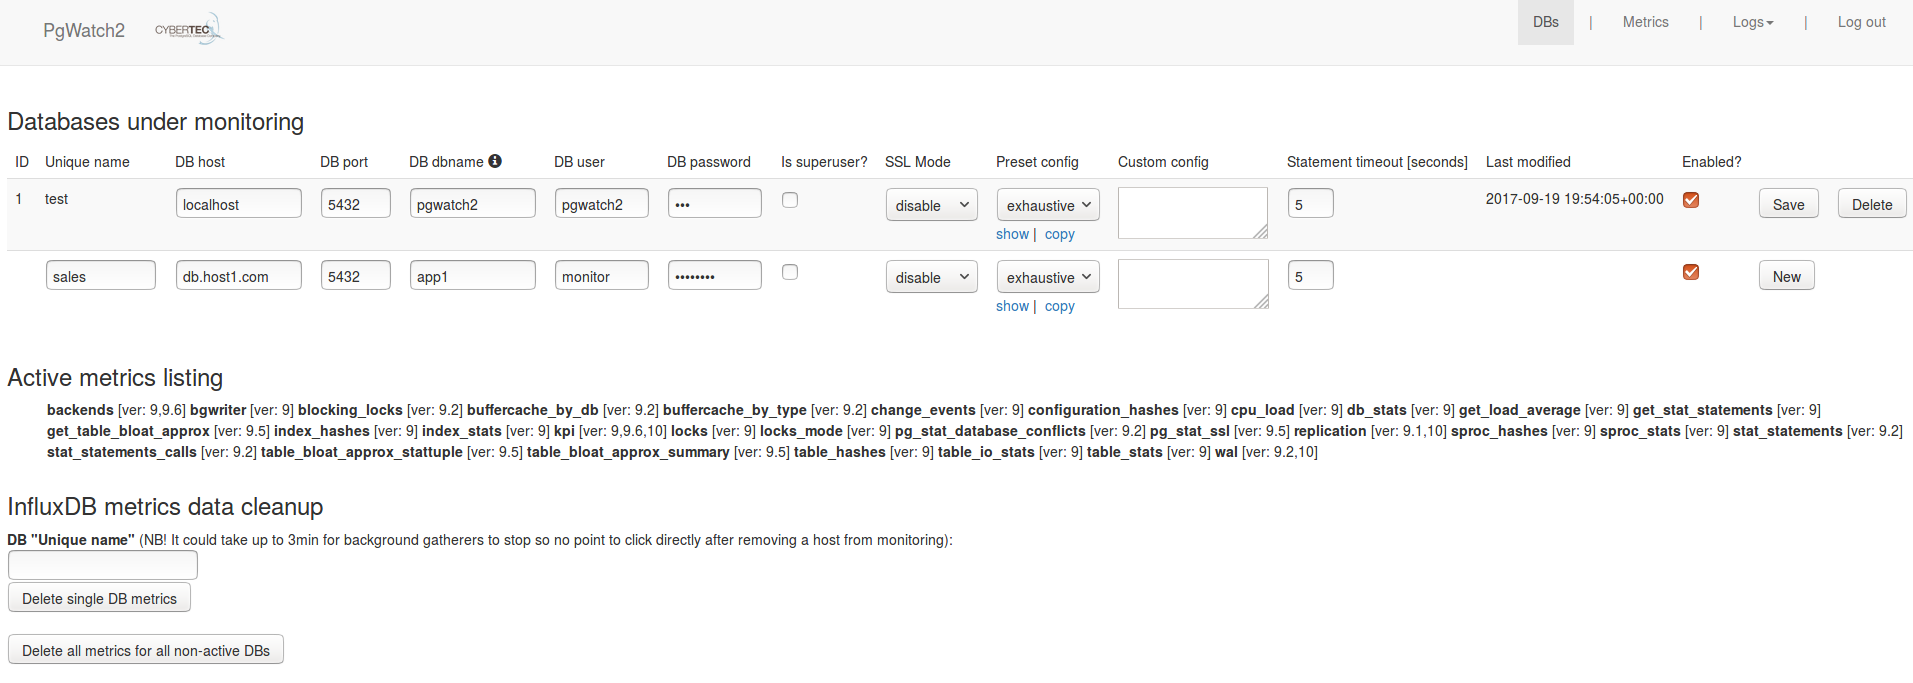
Previously one had to add all databases manually for a multi-db cluster, but now when leaving the “DB name” empty all DB-s are fetched, with those already being monitored skipped. A tip – when not sure what databases are there, uncheck the “Enabled” flag to review/enable/delete the found DB-s in the second step.
Previously this was only possible if connecting to the InfluxDB yourself via command line for example. Note that when removing a Postgres database host from monitoring, the gathered metrics are not automatically dropped as metrics gatherers work in the background and will take a minute or two to stop, so that’s the reason for two separate buttons.
Previously this was only possible when running the metrics gatherer and the config UI as standalone components, now there are bunch of environment variables available for that. See the README for details.
By default the demo database is there to make it easy for getting a first impression for new users, but for advanced users it could be tedious to remove the configuration and delete the metrics data from InfluxDB so now there a flag for that. Set NOTESTDB=1 for example to avoid monitoring the test DB.
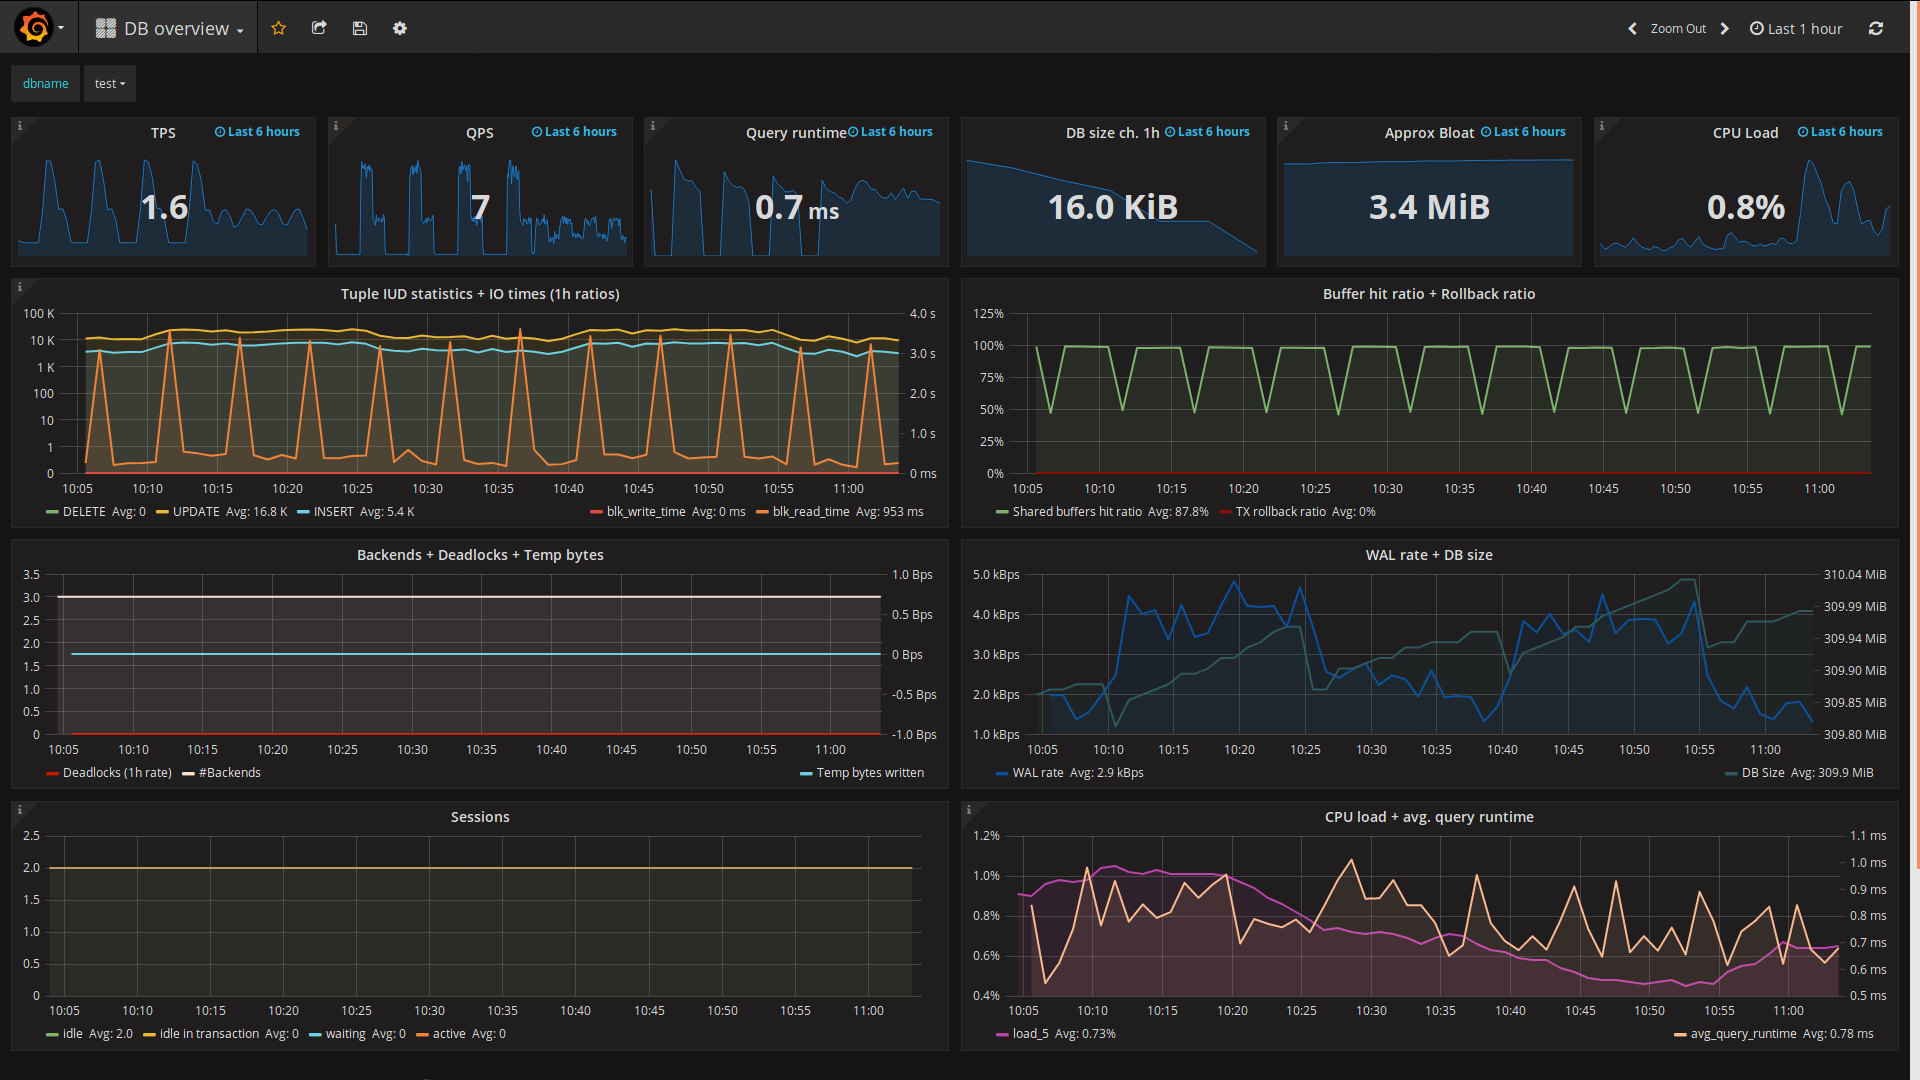
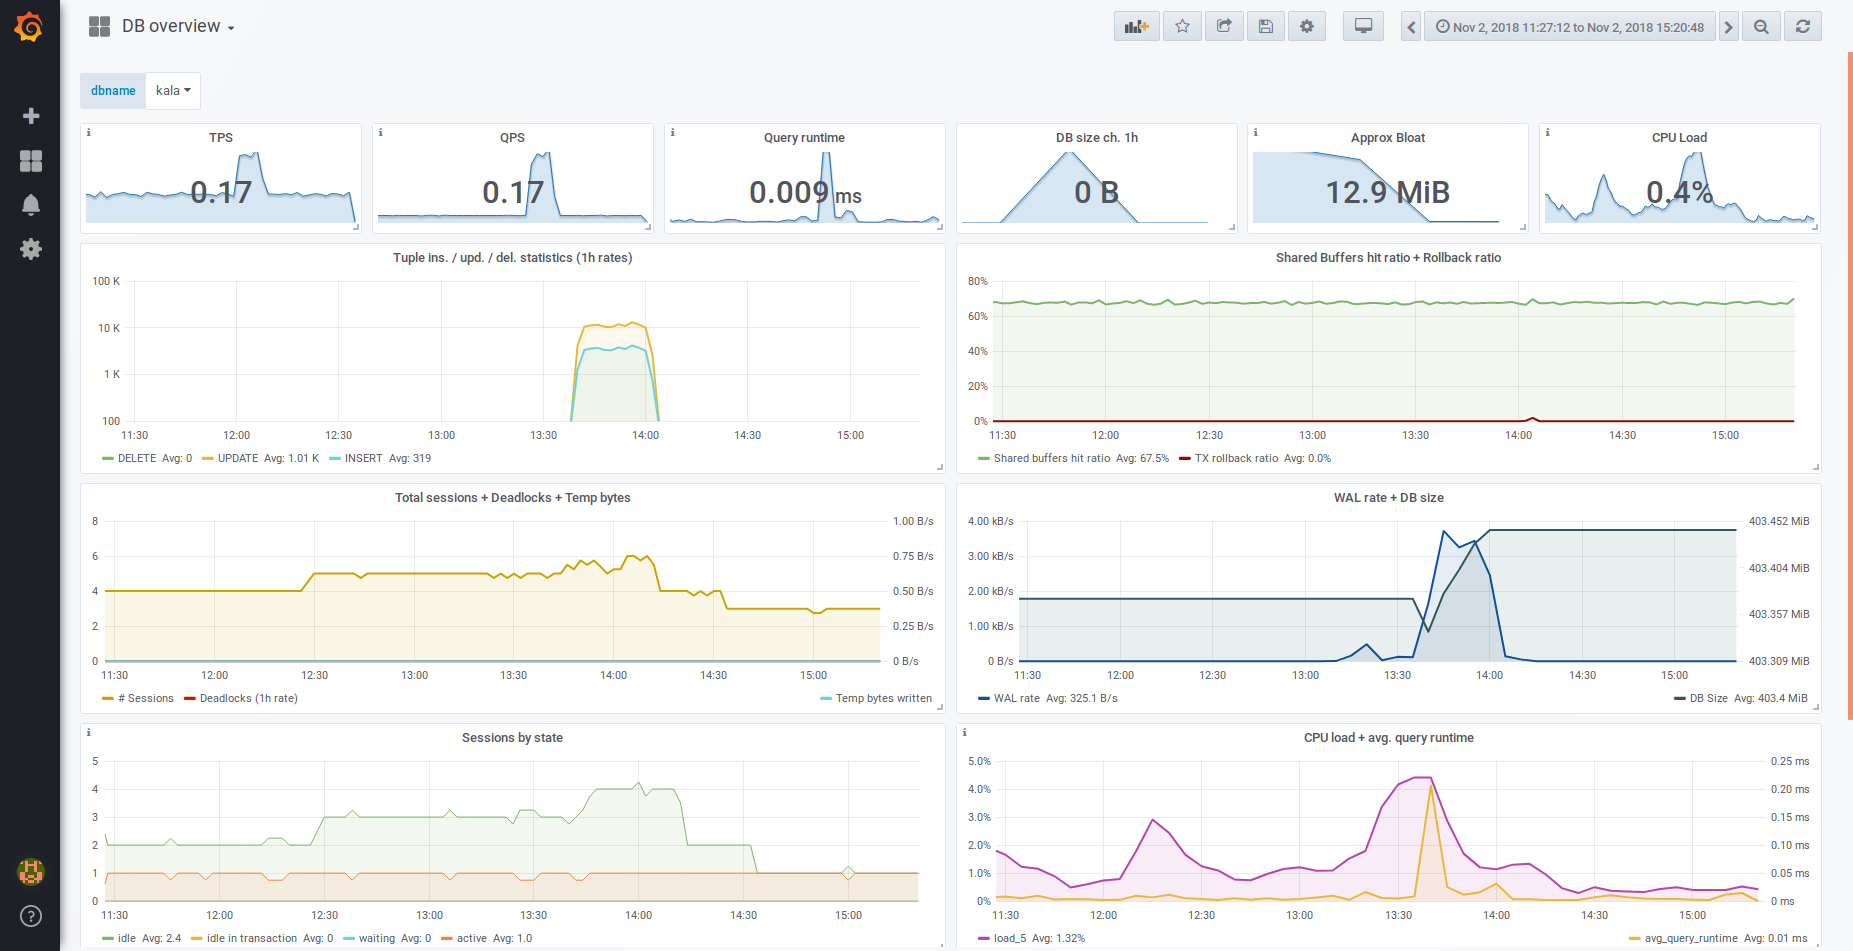
pgwatch2 provides out-of-the-box some sample dashboards to get going quickly but creating new ones is a point-and-click effort.
Grafana 4.5.1 and InfluxDB 1.3.5.
pgwatch2 is constantly being improved and new features are added. Learn more.
+43 (0) 2622 93022-0
office@cybertec.at
You are currently viewing a placeholder content from Facebook. To access the actual content, click the button below. Please note that doing so will share data with third-party providers.
More InformationYou are currently viewing a placeholder content from X. To access the actual content, click the button below. Please note that doing so will share data with third-party providers.
More Information
fantastic tool - thanks - im having a connection problem to a local db - ERRO main: could not start metric gathering for DB "BTPG10" due to connection problem: failed to set statement_timeout on BTPG10, query not tried - im sure this is simple config issue on my part but cant figure it out -
Ah you probably already created that Github issue about that - so yes, Github is a better place for such stuff...
also , i noticed a difference - when i add the password of my db acct - once saved , it switches back to 3 * - the text states if left to default 3* password will not be changed - my password is 4 chr
Yes currently it's just a constant "***" for all passwords - basically they're write-only currently as a security feature.
Thanks for writing this nice blog. Sql database security help to protect important data from the database and it barrier the harmful threat in the database.